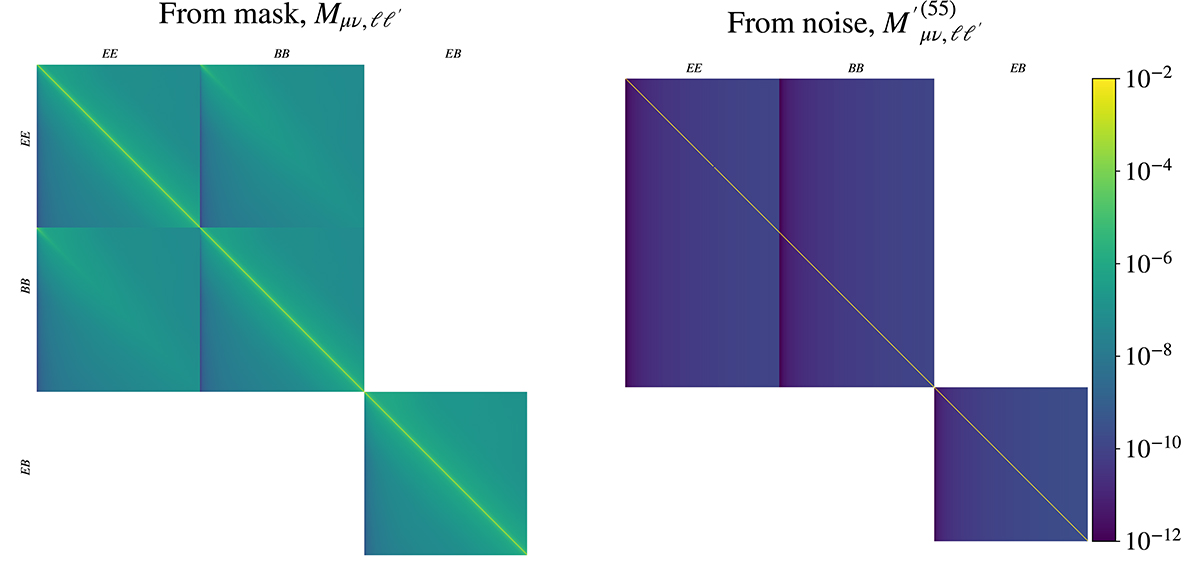
Fig. D.1.
Download original image
Bitmap of the mixing matrices to model the theoretical signal for the pseudo-Cls as seen by KiDS-1000. On the right panel is the mixing matrix derived from the KiDS-1000 mask, Mμν′,ℓℓ″, (the input mask is at a resolution of Nside = 1024). On the left panel is the mixing matrix caused by the selection due to randomly sampling galaxies for the auto-correlation of the fifth tomographic bin, ![]() . Both matrices are decomposed into block matrices separating the EE → EE, EE → BB and EB → EB mixing. Each block matrix has dimensions of 8193 × 8193 with ℓ ∈ {ℓ∈ℤ0+|ℓ ≤ 8192}.
. Both matrices are decomposed into block matrices separating the EE → EE, EE → BB and EB → EB mixing. Each block matrix has dimensions of 8193 × 8193 with ℓ ∈ {ℓ∈ℤ0+|ℓ ≤ 8192}.
Current usage metrics show cumulative count of Article Views (full-text article views including HTML views, PDF and ePub downloads, according to the available data) and Abstracts Views on Vision4Press platform.
Data correspond to usage on the plateform after 2015. The current usage metrics is available 48-96 hours after online publication and is updated daily on week days.
Initial download of the metrics may take a while.