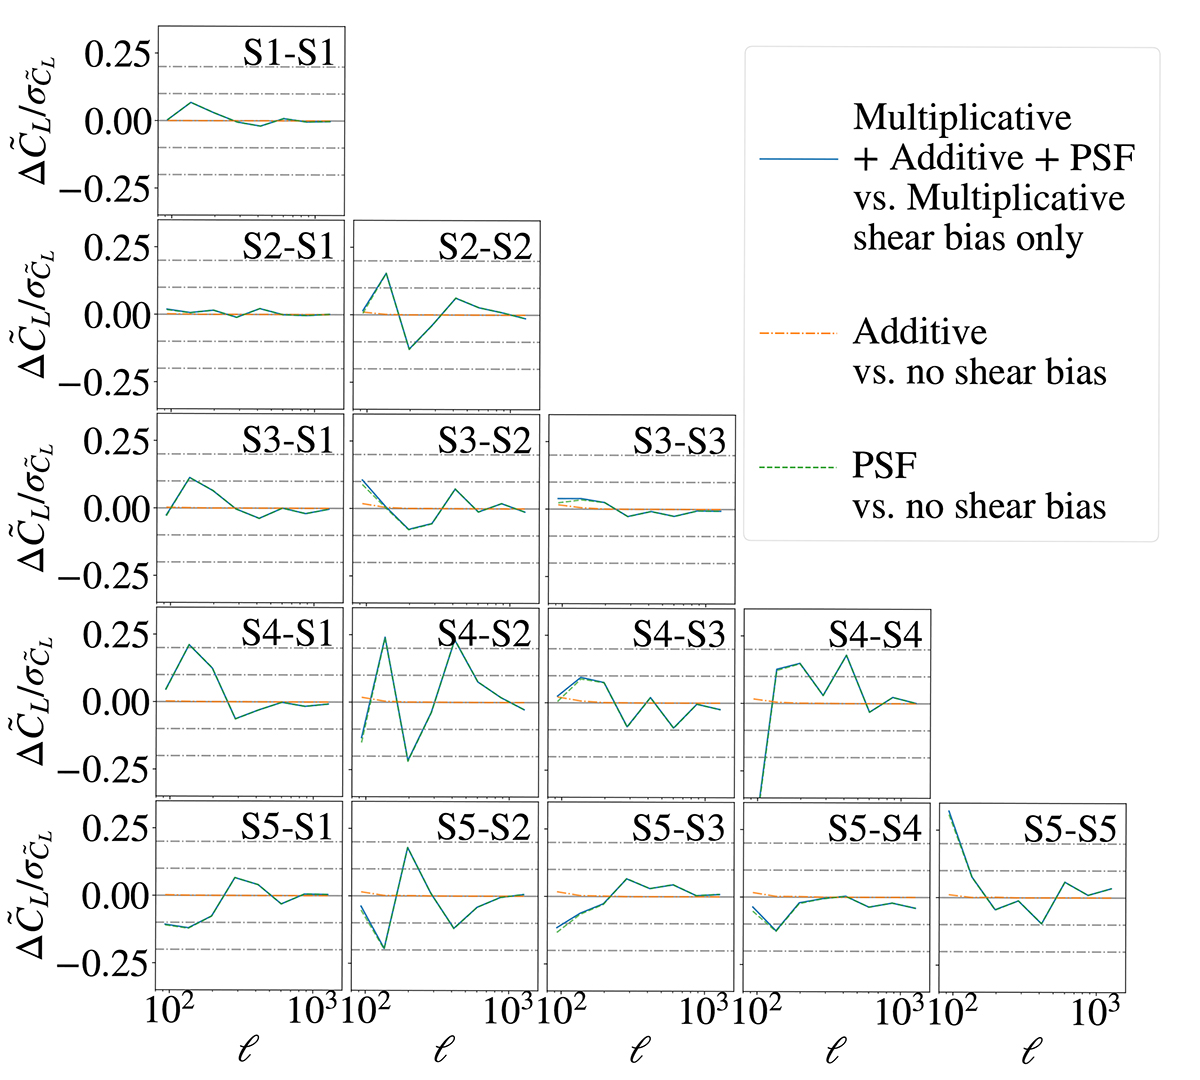
Fig. C.3.
Download original image
Relative difference between the mean pseudo-Cls measured in KiDS-SBI for different combinations of shear biases in KiDS-1000 as described in Sect. 3.7. The blue solid line compares the pseudo-Cls of a model that adds multiplicative, additive and PSF shear biases (as is the case in the anisotropic systematics model) to the signal measured from a model which only considers multiplicative shear bias (i.e. the standard isotropic systematics model). The orange dot-dashed line shows the effect of the additive shear bias alone, while the green dashed line shows the effect of the PSF shear bias alone. We note that, in particular, the PSF shear bias causes an up to 0.3σ bias in the pseudo-Cls, especially, at large scales.
Current usage metrics show cumulative count of Article Views (full-text article views including HTML views, PDF and ePub downloads, according to the available data) and Abstracts Views on Vision4Press platform.
Data correspond to usage on the plateform after 2015. The current usage metrics is available 48-96 hours after online publication and is updated daily on week days.
Initial download of the metrics may take a while.