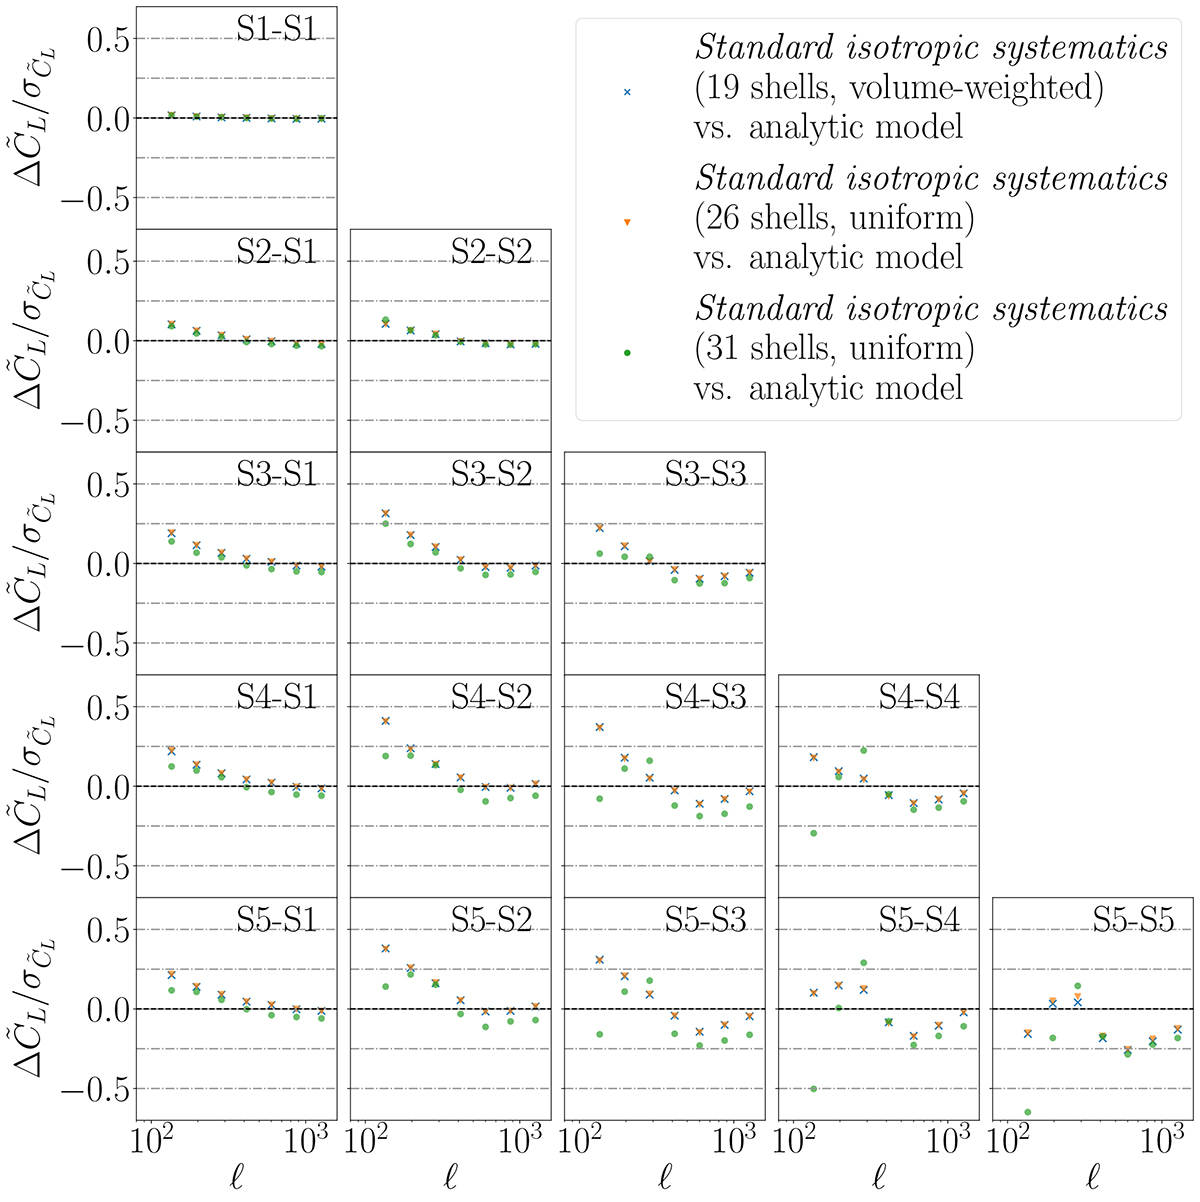
Fig. B.1.
Download original image
Relative difference between the mean pseudo-Cls measured from the standard isotropic systematics model in KiDS-SBI with different line-of-sight resolutions and the expectation from analytical theory as described in Appendix D. The blue crosses show the standard isotropic systematics model with the resolution assumed in the analysis discussed in this work: 19 shells with a comoving-volume weighted kernel. The orange triangles and the green circles show difference in the signal of standard isotropic systematics model with a uniform kernel and at higher resolutions: 26 shells and 31 shells, respectively. All are evaluated at the MAP cosmology inferred from the KiDS-1000 data using the standard isotropic systematics in KiDS-SBI (see Table F.1).
Current usage metrics show cumulative count of Article Views (full-text article views including HTML views, PDF and ePub downloads, according to the available data) and Abstracts Views on Vision4Press platform.
Data correspond to usage on the plateform after 2015. The current usage metrics is available 48-96 hours after online publication and is updated daily on week days.
Initial download of the metrics may take a while.