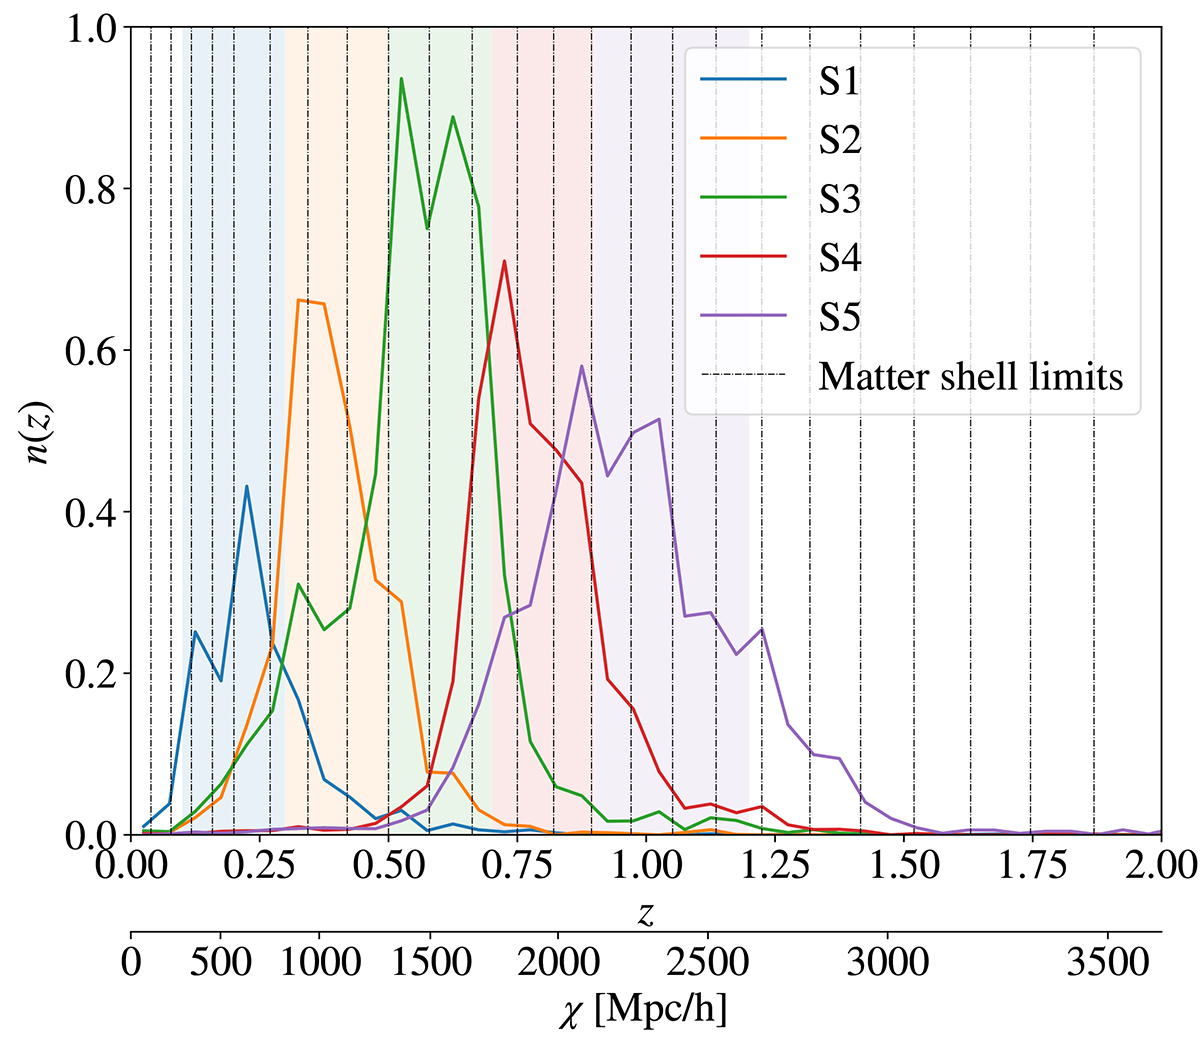
Fig. 2.
Download original image
Redshift distributions of the five KiDS-1000 tomographic bins. The shaded areas show to limits of each tomographic bin, while the solid lines show the n(z) of the source galaxies in each tomographic bin as a function of both redshift, z, and comoving distance, χ (the latter is derived assuming a Planck 2018 cosmology; Planck Collaboration VI 2020). The black dashed lines show the limits of the spherical matter shells in our forward simulations.
Current usage metrics show cumulative count of Article Views (full-text article views including HTML views, PDF and ePub downloads, according to the available data) and Abstracts Views on Vision4Press platform.
Data correspond to usage on the plateform after 2015. The current usage metrics is available 48-96 hours after online publication and is updated daily on week days.
Initial download of the metrics may take a while.