Fig. 15.
Download original image
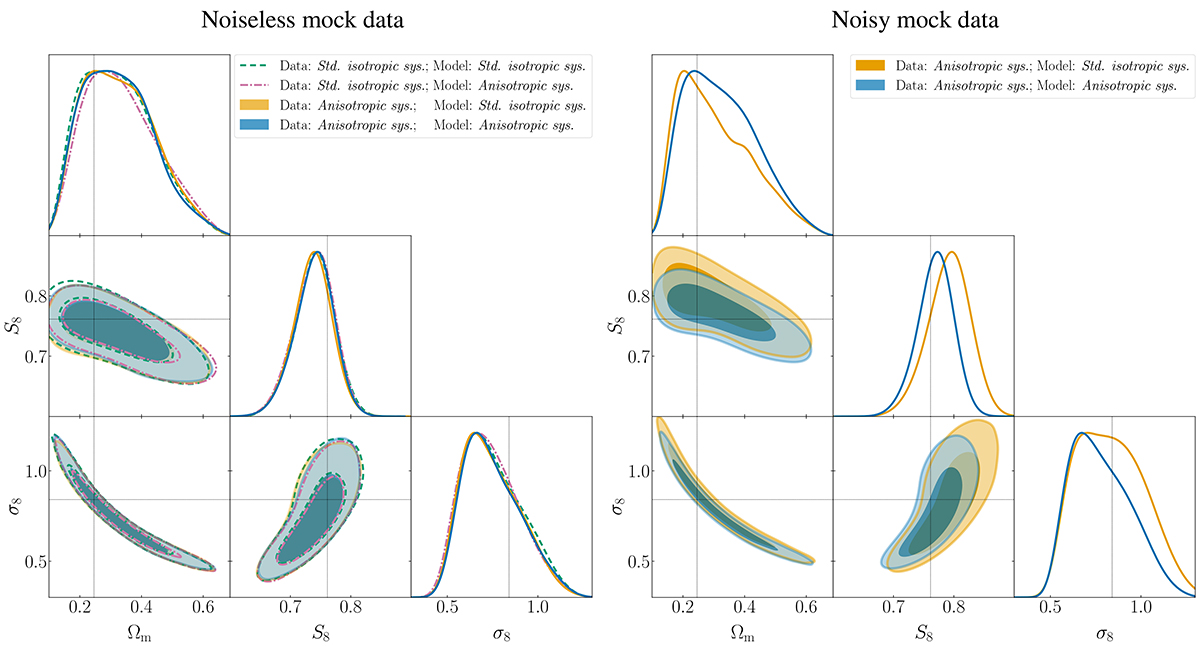
Contour plots comparing the effects of model misspecification for different model cases and noise levels in the data. Left panel: Comparison of marginalised posterior contours from noise-free data assuming the anisotropic systematics model (which includes variable depth and PSF variations) in blue and green, and the standard isotropic systematics model (which is in line with the analysis assumptions in Asgari et al. 2021, i.e. it does not model variable depth or PSF variations) in orange and pink. The orange and the blue posteriors are derived from the same data vector: a noise-free realisation from the anisotropic systematics model at the fiducial cosmology shown in Table 2; while the pink and the green posteriors are derived from a noise-free realisation from the standard isotropic systematics model at the same cosmology. Right panel: Comparison of marginalised posterior contours from noisy data simulated with anisotropic systematics model with the same seed as in the noise-free case, and subsequently analysed with the SBI based on the anisotropic systematics model in blue, and standard isotropic systematics model in orange. In both panels, the black solid line indicates the true cosmology assumed for the mock data vector (see Table E.1).
Current usage metrics show cumulative count of Article Views (full-text article views including HTML views, PDF and ePub downloads, according to the available data) and Abstracts Views on Vision4Press platform.
Data correspond to usage on the plateform after 2015. The current usage metrics is available 48-96 hours after online publication and is updated daily on week days.
Initial download of the metrics may take a while.