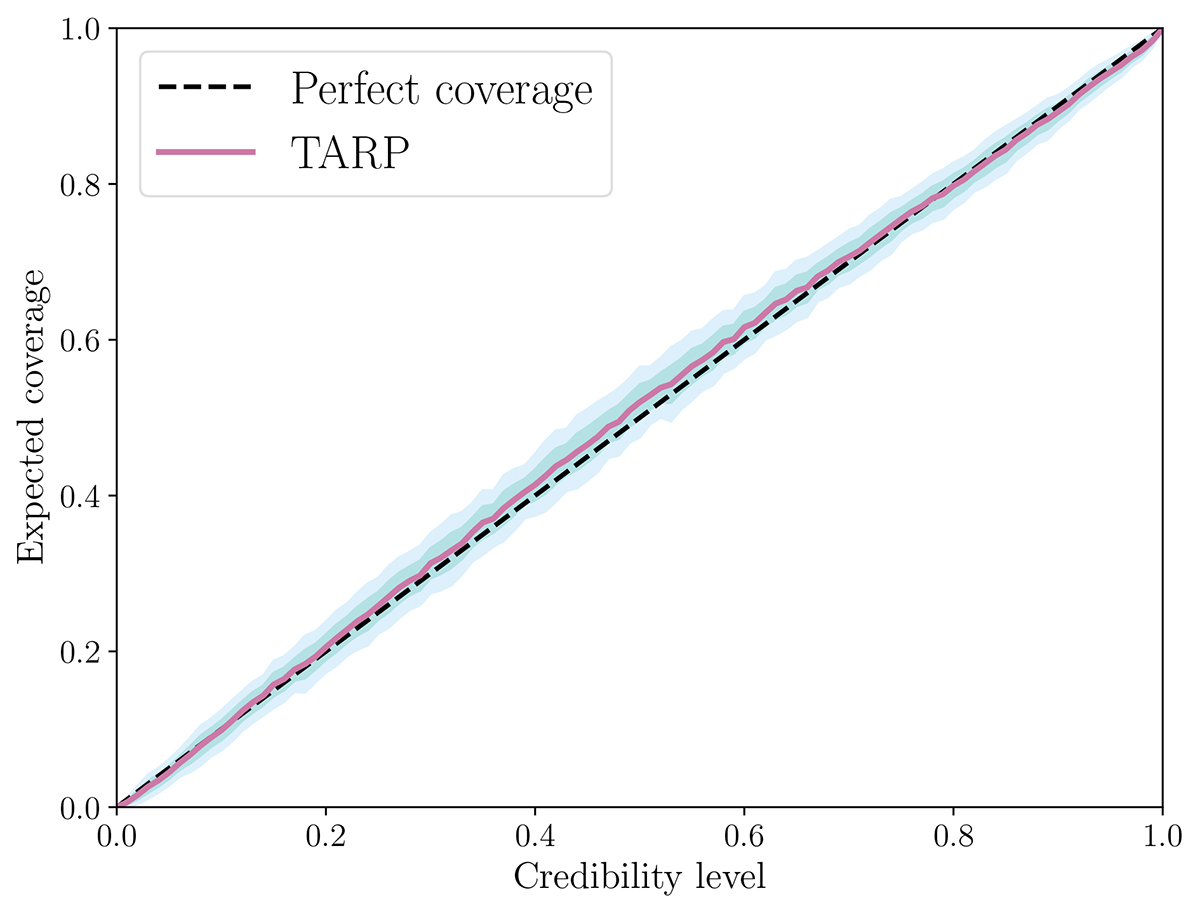
Fig. 14.
Download original image
The expected coverage probability versus the credibility level as defined in the Tests of Accuracy with Random Points (TARP) described in Lemos et al. (2023a) for the posterior shown in Fig. D.2 assuming the anisotropic systematics model. The dark blue region indicates the 1σ fluctuations in the TARP obtained from bootstrapping over 100 realisations, while the light blue region indicates the 2σ region. The dashed line is a reference line for a perfectly linear relation. The credibility level gives the fraction of the total probability density of the learnt posterior being considered, while the expected coverage probability measures the fraction of posterior samples which have a posterior probability smaller than the best estimate at a given credibility level. We note the relation, in this case, indicates slight underconfidence, such that the posteriors in Figs. D.2 and 18 can be considered as conservative. The ideal case is completely within the 1σ confidence interval of the TARP test.
Current usage metrics show cumulative count of Article Views (full-text article views including HTML views, PDF and ePub downloads, according to the available data) and Abstracts Views on Vision4Press platform.
Data correspond to usage on the plateform after 2015. The current usage metrics is available 48-96 hours after online publication and is updated daily on week days.
Initial download of the metrics may take a while.