Fig. 10.
Download original image
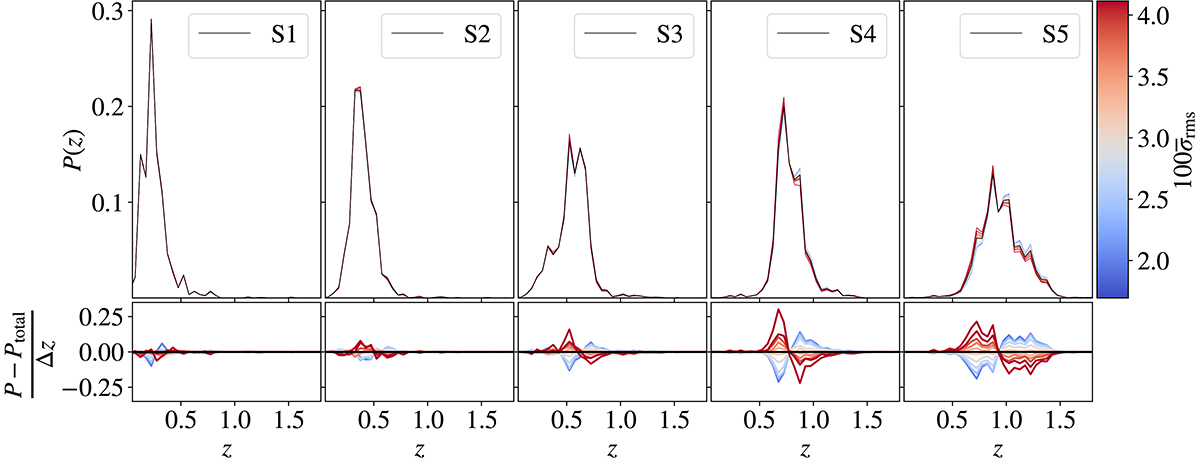
In the upper panels, the normalised redshift distributions, P(z), for each tomographic bin (S1 to S5). The redshift distribution from the entire KiDS-1000 DR4 galaxy sample, Ptotal(z), is shown in black, while the other ten redshift distributions are derived from 10 equi-populated subsamples of DR4 based on their observational depth (i.e. the mean value of the root-mean-square of the background noise, ![]() ) which is shown with its respective colour. The lower panels show the associated residual change in the redshift distributions with respect to Ptotal(z) per unit redshift. It is apparent that variable depth mostly affects the source distributions at high redshifts, while the effect tends to decrease the mean of the redshift distribution with increasing σrms.
) which is shown with its respective colour. The lower panels show the associated residual change in the redshift distributions with respect to Ptotal(z) per unit redshift. It is apparent that variable depth mostly affects the source distributions at high redshifts, while the effect tends to decrease the mean of the redshift distribution with increasing σrms.
Current usage metrics show cumulative count of Article Views (full-text article views including HTML views, PDF and ePub downloads, according to the available data) and Abstracts Views on Vision4Press platform.
Data correspond to usage on the plateform after 2015. The current usage metrics is available 48-96 hours after online publication and is updated daily on week days.
Initial download of the metrics may take a while.