Fig. 8.
Download original image
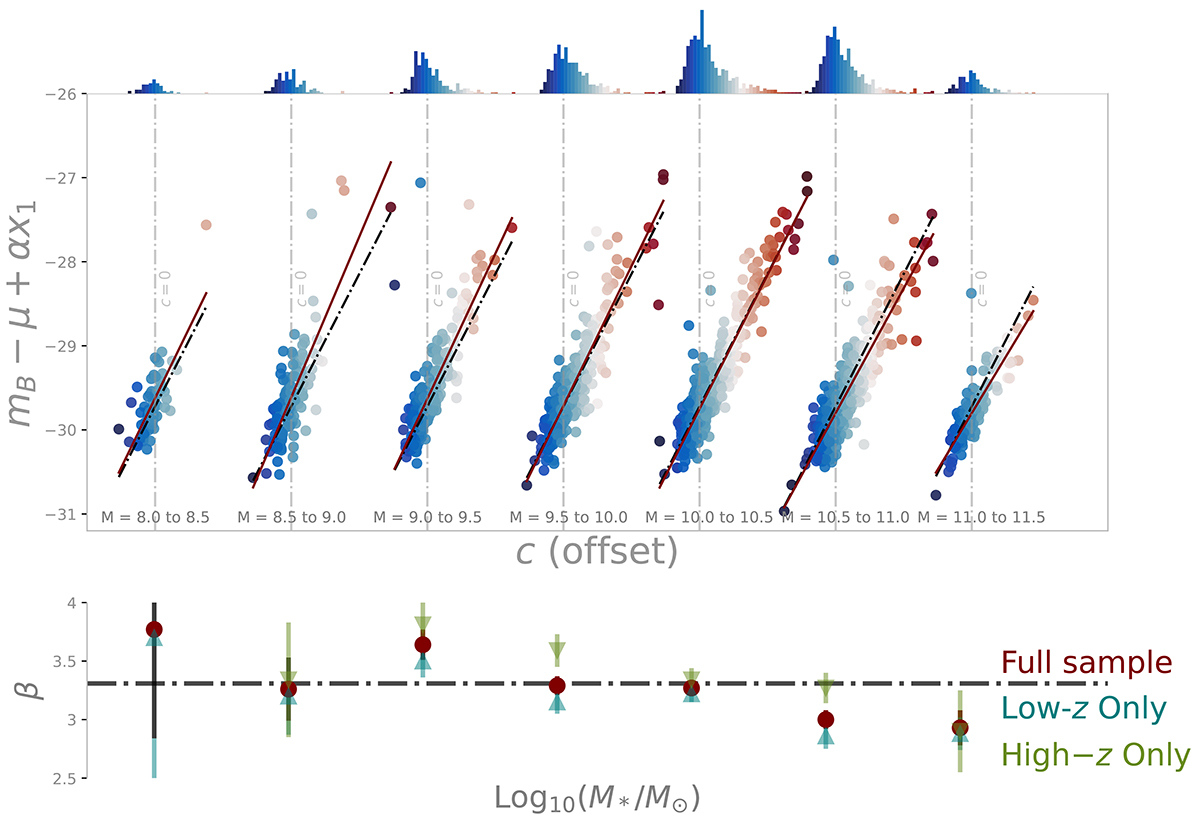
Comparison of c vs. mB − μ + αx1, offset in bins of host galaxy mass, shown in the main plot. The SNe are colour-coded by their colour, c, for visual guidance. The slope (β value) for each mass bin is shown in red, alongside the fiducial beta in black dash-dotted line. The light grey dash-dotted vertical line shows the c = 0 point for each mass bin. Top: Colour histograms for each of the mass bins is shown, colour-coded according to c. Inset: β vs mass relationship for the fitted mass bins. The β values for the full sample are presented in brown points, the ZTF-only β values in teal triangle, and the high-redshift sample in olive triangle, with the fiducial β shown in grey dash-dotted line. See Sect. 4.3 for more details.
Current usage metrics show cumulative count of Article Views (full-text article views including HTML views, PDF and ePub downloads, according to the available data) and Abstracts Views on Vision4Press platform.
Data correspond to usage on the plateform after 2015. The current usage metrics is available 48-96 hours after online publication and is updated daily on week days.
Initial download of the metrics may take a while.