Fig. 7.
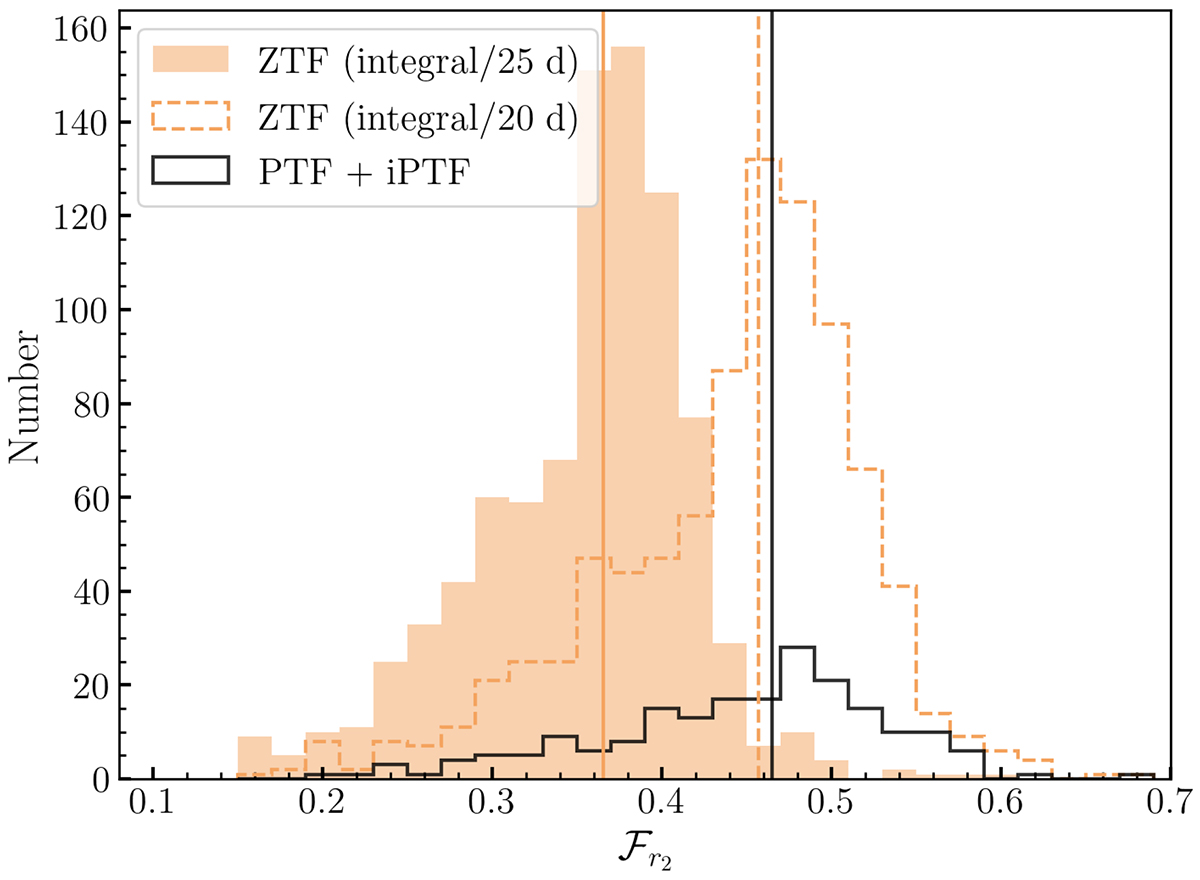
Download original image
Histogram showing the distribution of ℱr2 for the ZTF DR2 sample with the flux integral divided by 25 d (shaded orange) or divided by 20 d (dashed orange), compared to the distribution found for PTF and iPTF by Papadogiannakis et al. (2019a) (black). The median of the PTF+iPTF population is 1.5σ higher than the median of the ZTF DR2 population when the integral is divided by 25 d, but the ZTF distribution is consistent with the PTF+iPTF distribution if the integral is divided by 20 d instead.
Current usage metrics show cumulative count of Article Views (full-text article views including HTML views, PDF and ePub downloads, according to the available data) and Abstracts Views on Vision4Press platform.
Data correspond to usage on the plateform after 2015. The current usage metrics is available 48-96 hours after online publication and is updated daily on week days.
Initial download of the metrics may take a while.