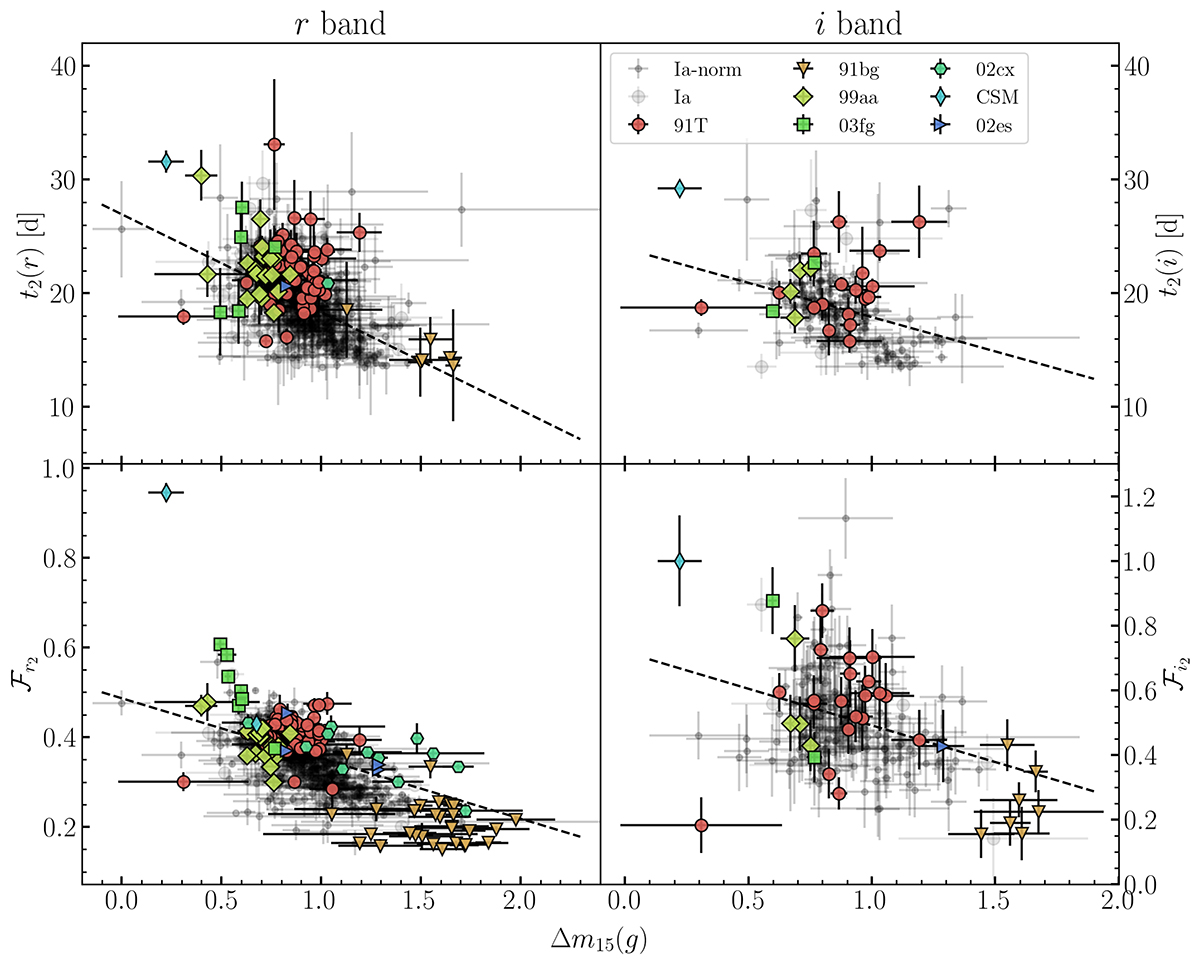
Fig. 6.
Download original image
Timing of secondary maximum (t2(x), top) and normalised integrated flux in the range of 15–40 d (ℱx2, bottom) in the r band (left) and i band (right) as a function of Δm15(g) for our sample. We also show simple linear regression fits to the whole sample (black dashed lines). We find a non-zero slope at the > 5σ confidence level for t2(r), t2(i), ℱr2, but not for ℱi2 with Δm15(g).
Current usage metrics show cumulative count of Article Views (full-text article views including HTML views, PDF and ePub downloads, according to the available data) and Abstracts Views on Vision4Press platform.
Data correspond to usage on the plateform after 2015. The current usage metrics is available 48-96 hours after online publication and is updated daily on week days.
Initial download of the metrics may take a while.