Fig. 5.
Download original image
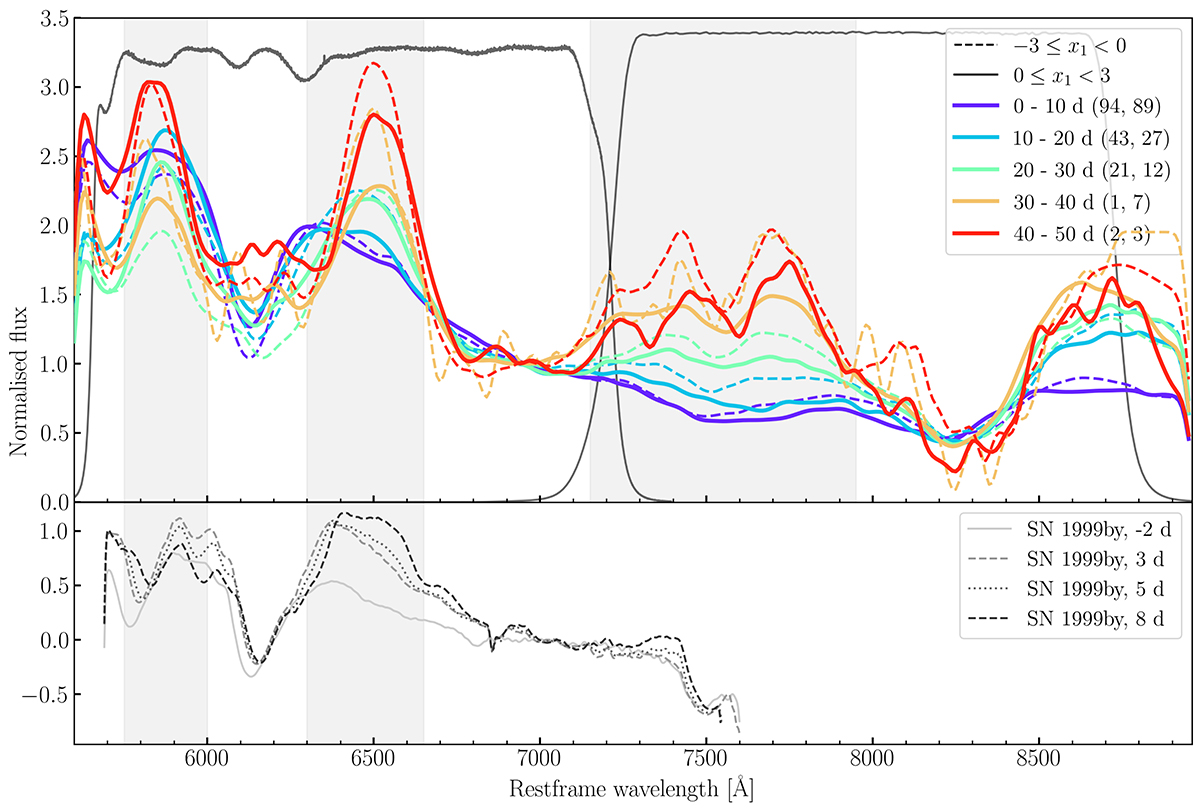
Averaged spectra between 0–10, 10–20, 20–30, 30–40, and 40–50 d in the r- and i-band wavelength ranges. The phases are relative to g-band maximum. Spectra are binned into −3 ≤ x1 < 0 (dashed) and 0 ≤ x1 < 3 (solid). The grey shaded regions indicate the spectral regions where a feature appears during the onset of the secondary maximum. The numbers in the brackets represent the number of spectra going into each bin (first number represents the number of spectra in the −3 ≤ x1 < 0 bin, and the second number are the number of spectra in the 0 ≤ x1 < 3 bin). We also show the filter response functions of the ZTF r and i bands in black. In the bottom panel we show a spectral timeseries of SN 1999by (a 91bg-like SN Ia).
Current usage metrics show cumulative count of Article Views (full-text article views including HTML views, PDF and ePub downloads, according to the available data) and Abstracts Views on Vision4Press platform.
Data correspond to usage on the plateform after 2015. The current usage metrics is available 48-96 hours after online publication and is updated daily on week days.
Initial download of the metrics may take a while.