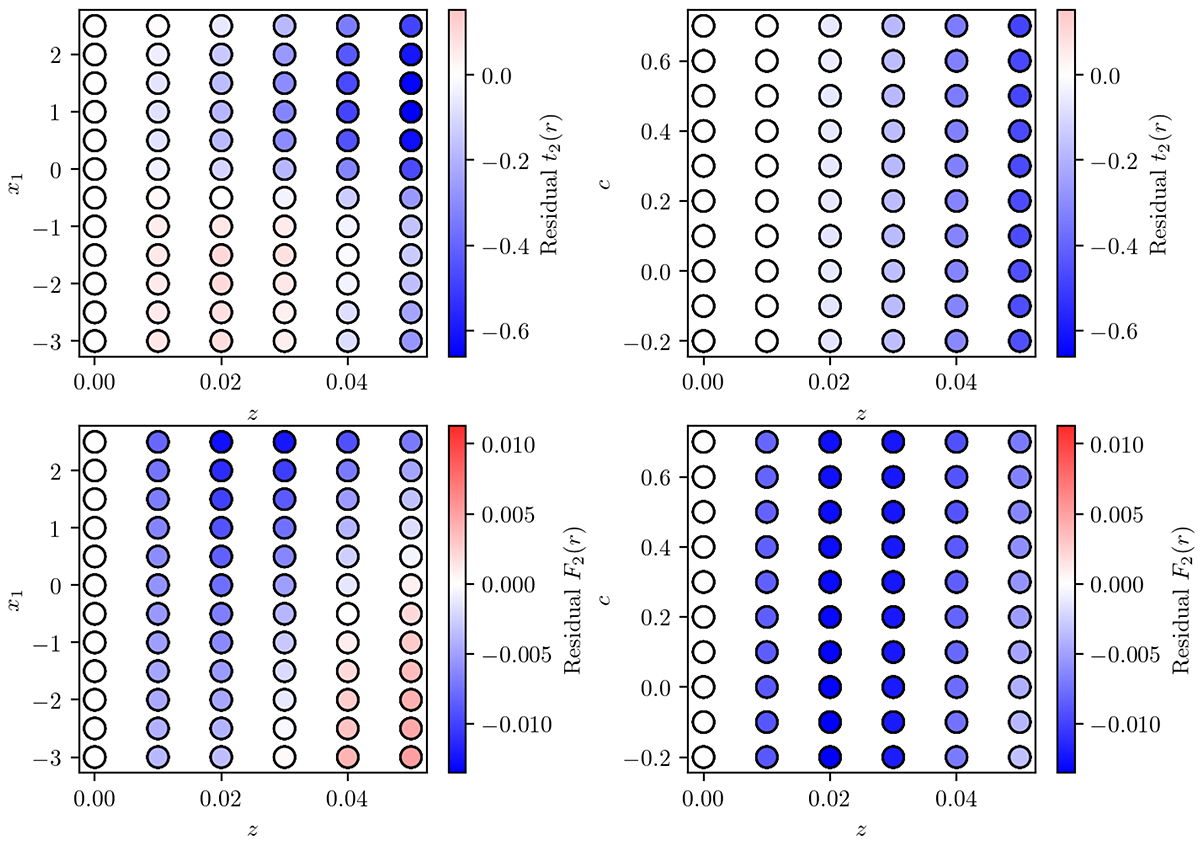
Fig. 4.
Download original image
Impact of K-corrections on t2(r) (top) and ℱr2 (bottom), as a function of redshift and x1 (left) and c (right). The colour of the data points represents the residual between the measured parameter in the SALT3 model at that point and the same model at z = 0. Overall, the impact of K-corrections is small, with a maximum residual on ℱr2 of 0.014 and on t2(r) of 0.66 d.
Current usage metrics show cumulative count of Article Views (full-text article views including HTML views, PDF and ePub downloads, according to the available data) and Abstracts Views on Vision4Press platform.
Data correspond to usage on the plateform after 2015. The current usage metrics is available 48-96 hours after online publication and is updated daily on week days.
Initial download of the metrics may take a while.