Fig. 12.
Download original image
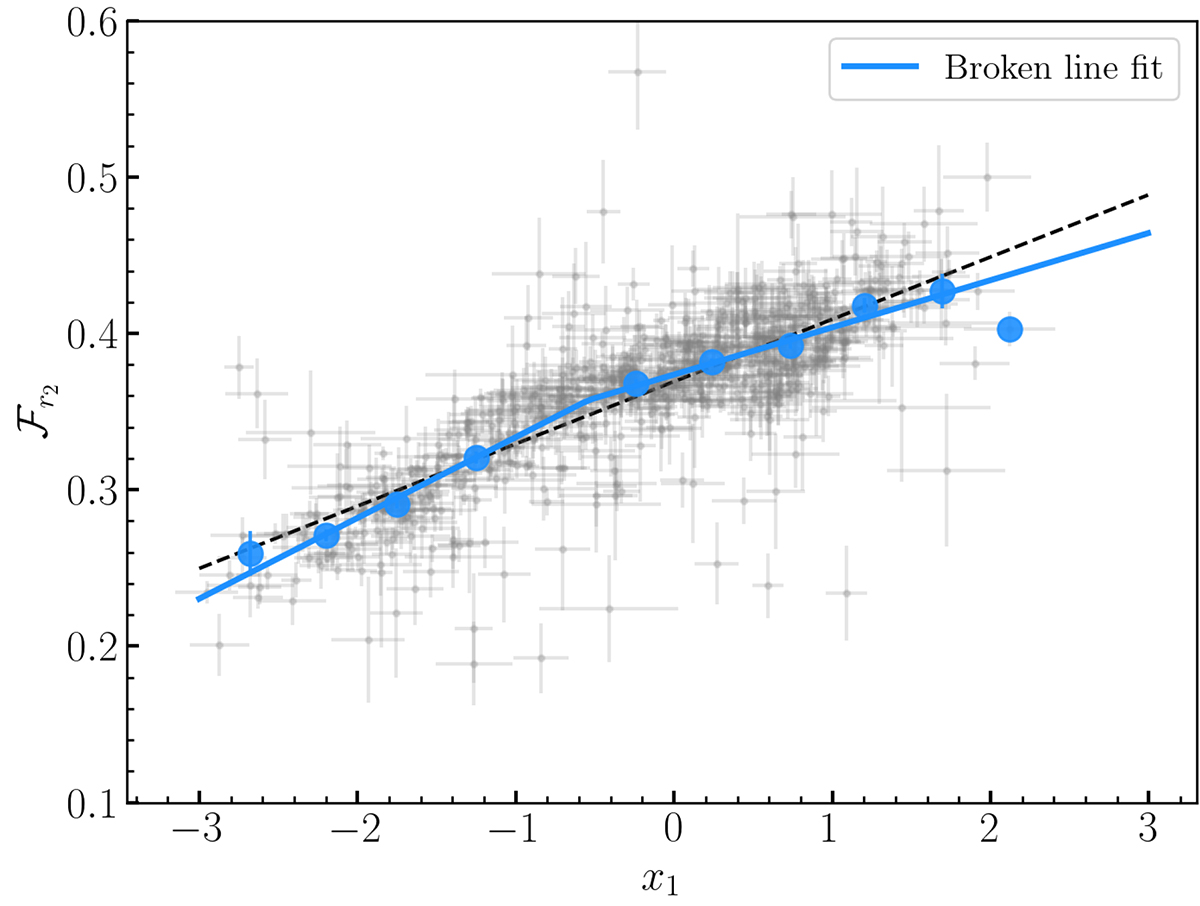
ℱr2 as a function of x1 for SNe Ia in our cosmological sub-sample. We fit the population with a broken line (blue) and linear fit (black, dashed). We find the best-fit value of the stretch split to be at x10 = − 0.5 ± 0.2. The blue points show the data binned by stretch, taking the mean and standard error of the mean in each bin.
Current usage metrics show cumulative count of Article Views (full-text article views including HTML views, PDF and ePub downloads, according to the available data) and Abstracts Views on Vision4Press platform.
Data correspond to usage on the plateform after 2015. The current usage metrics is available 48-96 hours after online publication and is updated daily on week days.
Initial download of the metrics may take a while.