Fig. 10.
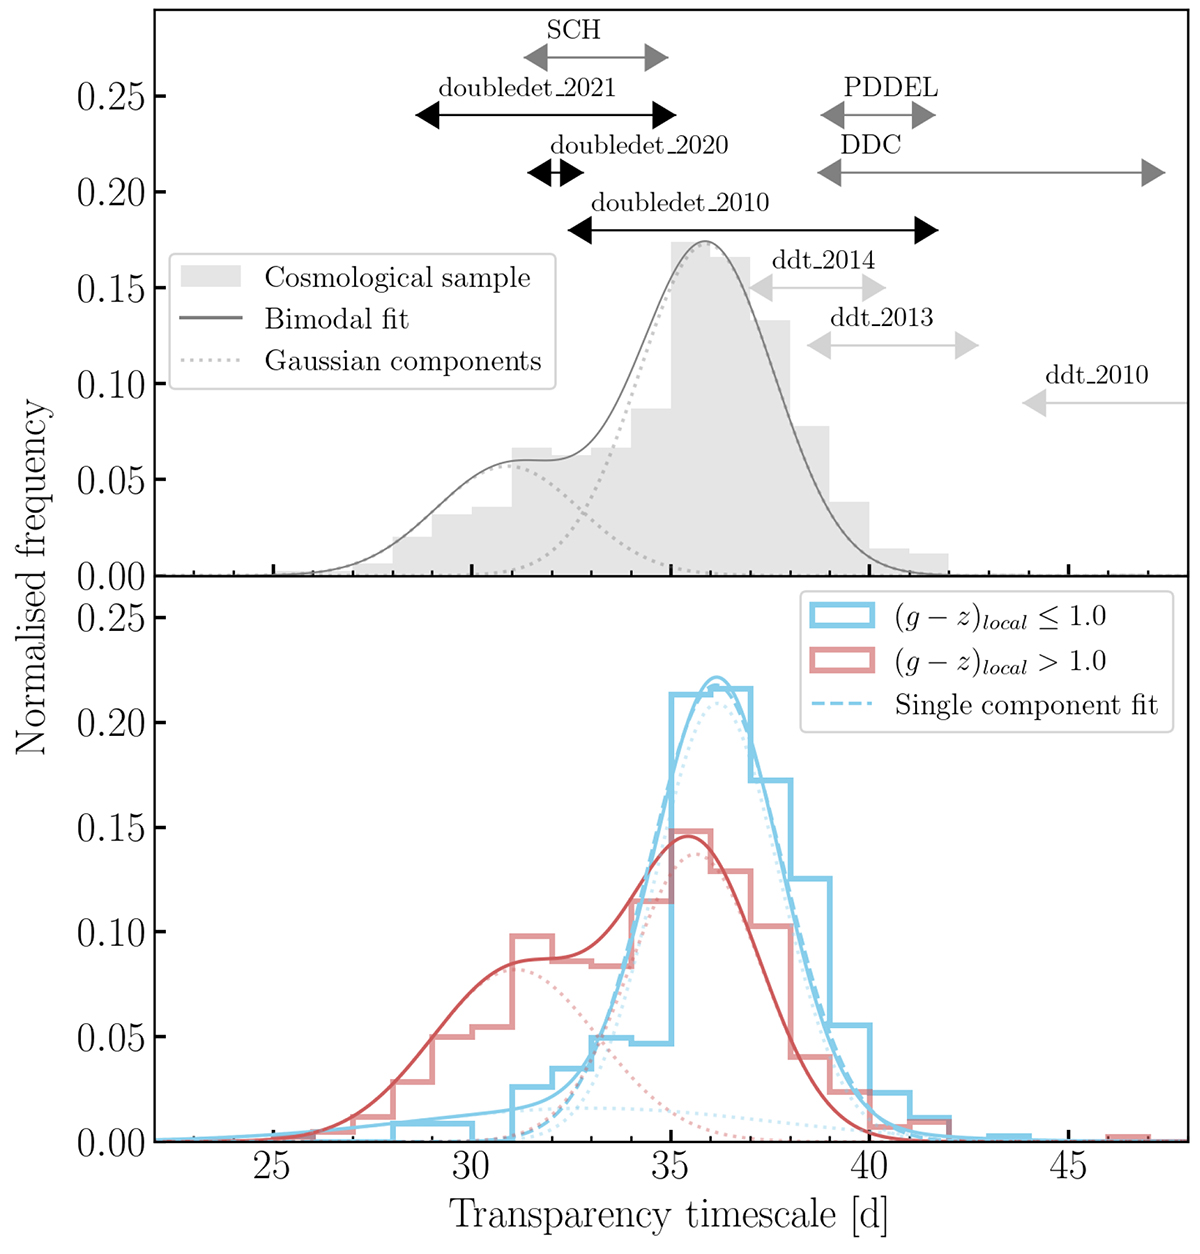
Download original image
Distributions of transparency timescales for the whole cosmological sub-sample are shown at the top (grey), along with a bimodal Gaussian fit (solid grey line) and its individual components (dashed grey). The arrows show the ranges of transparency timescales predicted by doubledet_2010 (Fink et al. 2010; Kromer et al. 2010), doubledet_2020, (Gronow et al. 2020), doubledet_2021(Gronow et al. 2021), ddt_2010 (Fink 2010), ddt_2013 (Seitenzahl et al. 2013; Sim et al. 2013), ddt_2014 (Ohlmann et al. 2014), SCH, PDDEL, and DDC (Blondin et al. 2017) explosions models. In the bottom plot we separate the transparency timescale distribution into SNe Ia with blue local colours ((g − z)local ≤ 1.0, blue) or red local colours ((g − z)local > 1.0, red). We show bimodal Gaussian the fits to both distributions, and the individual components making up the fit are shown as dotted lines. The Akaike Information Criterion (AIC) test prefers a bimodal fit for the SNe Ia in red local environments, but it does not show a preference for either the double component fit or single component fit for the SNe Ia population in blue environments, so we also show the single component fit as a dashed line to this population.
Current usage metrics show cumulative count of Article Views (full-text article views including HTML views, PDF and ePub downloads, according to the available data) and Abstracts Views on Vision4Press platform.
Data correspond to usage on the plateform after 2015. The current usage metrics is available 48-96 hours after online publication and is updated daily on week days.
Initial download of the metrics may take a while.