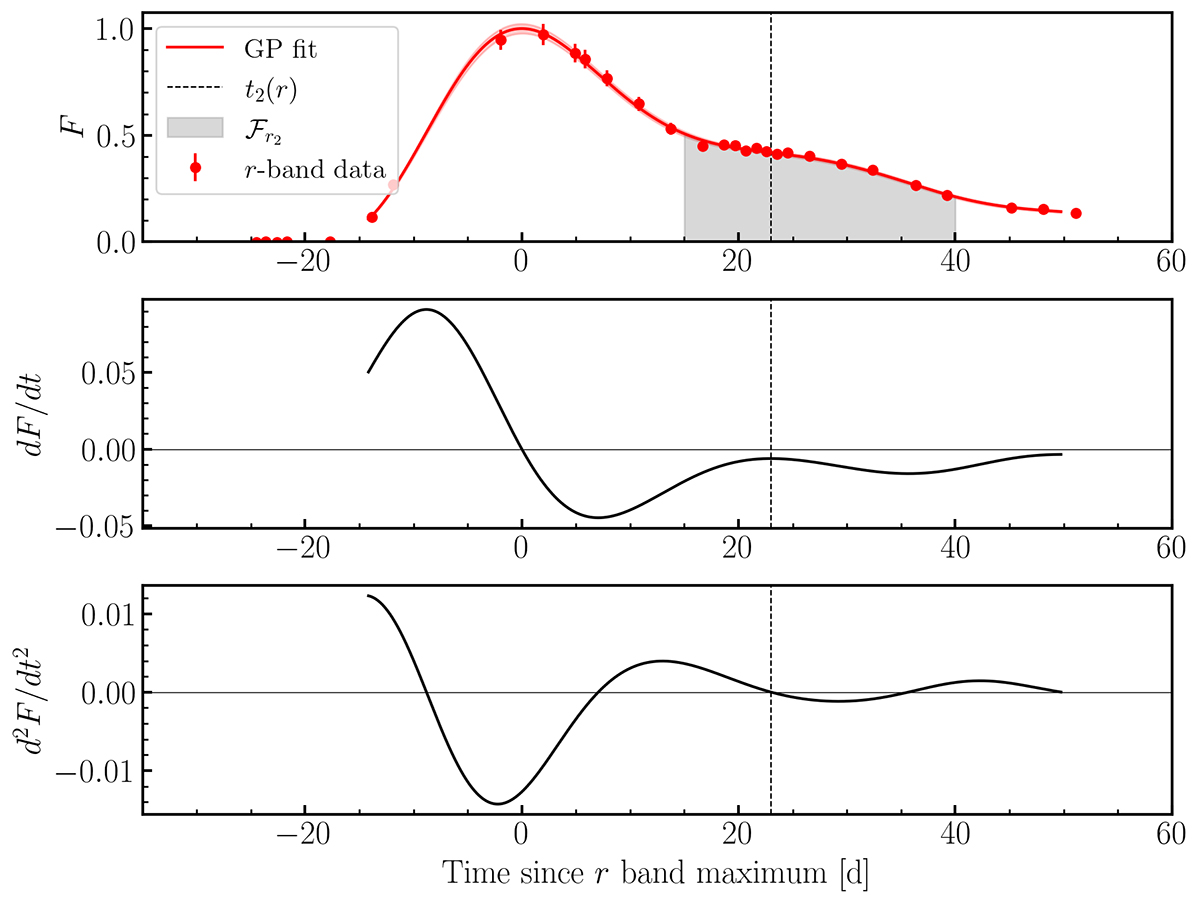
Fig. 1.
Download original image
Example of GP fit to a r-band light curve (top). The GP fit is shown as a red and the 1σ uncertainty is shown as the red shaded region. The area over which the integrated flux under the secondary maximum, ℱr2, is calculated is indicated by the grey shaded region, and t2(r) by the black dashed. The first derivative of the GP light curve (middle). This light curve has a secondary shoulder rather than a secondary maximum because the first derivative is not equal to zero. The second derivative of the GP light curve (bottom), shows that the time of the onset of the secondary maximum is the time at which the second derivative is equal to zero, also known as an inflection point.
Current usage metrics show cumulative count of Article Views (full-text article views including HTML views, PDF and ePub downloads, according to the available data) and Abstracts Views on Vision4Press platform.
Data correspond to usage on the plateform after 2015. The current usage metrics is available 48-96 hours after online publication and is updated daily on week days.
Initial download of the metrics may take a while.