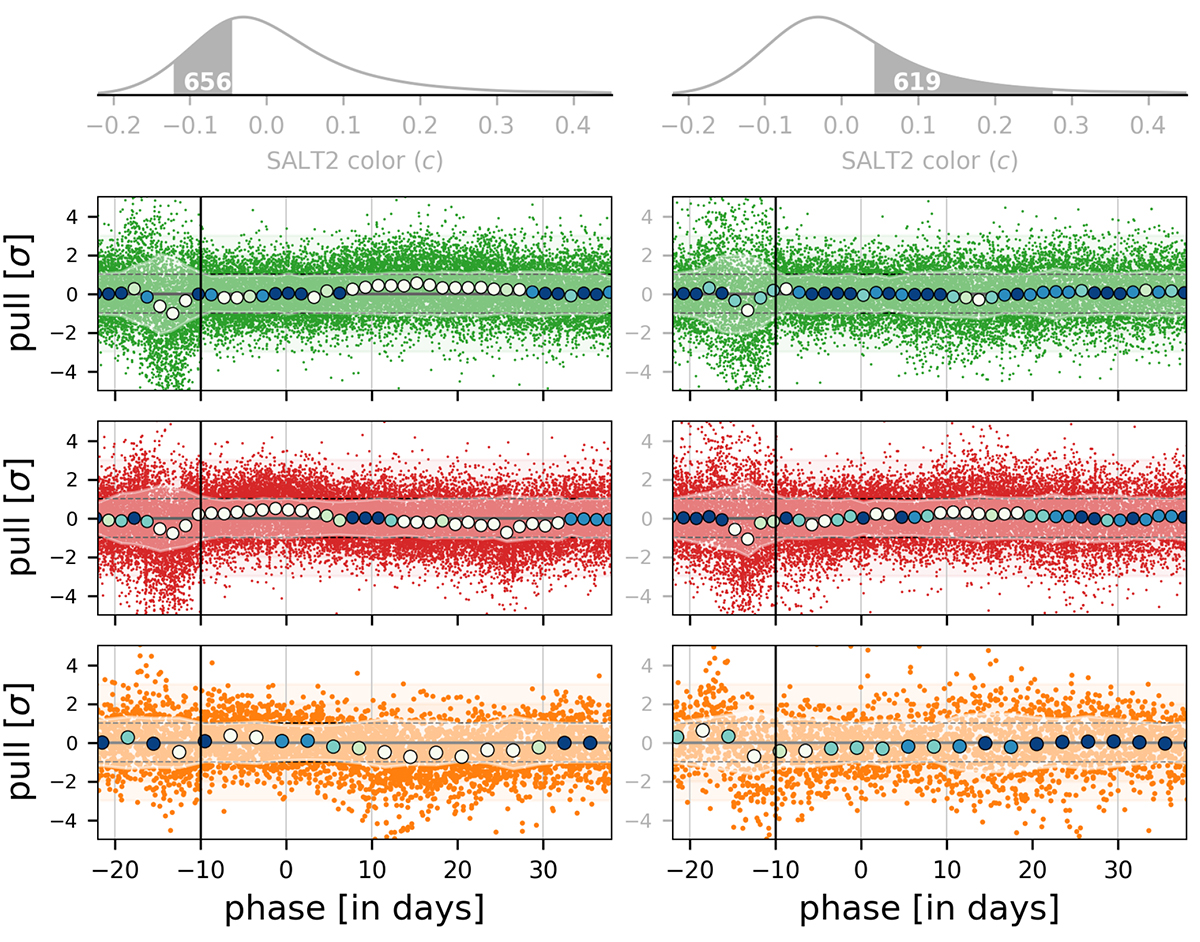
Fig. 4.
Download original image
Similar to Fig. 1, but split per light-curve color (c) to separately probe blue and red SNe Ia. For visibility, the phase bins are 1.5 d in g and r and 3 d in i. Left side: c ∈ [5%,30%] percentile SNe Ia. Right side: c ∈ [70%,95%] percentile SNe Ia. Top: SN Ia color distributions highlighting the part considered on each side, indicating the corresponding sample size.
Current usage metrics show cumulative count of Article Views (full-text article views including HTML views, PDF and ePub downloads, according to the available data) and Abstracts Views on Vision4Press platform.
Data correspond to usage on the plateform after 2015. The current usage metrics is available 48-96 hours after online publication and is updated daily on week days.
Initial download of the metrics may take a while.