Fig. 2.
Download original image
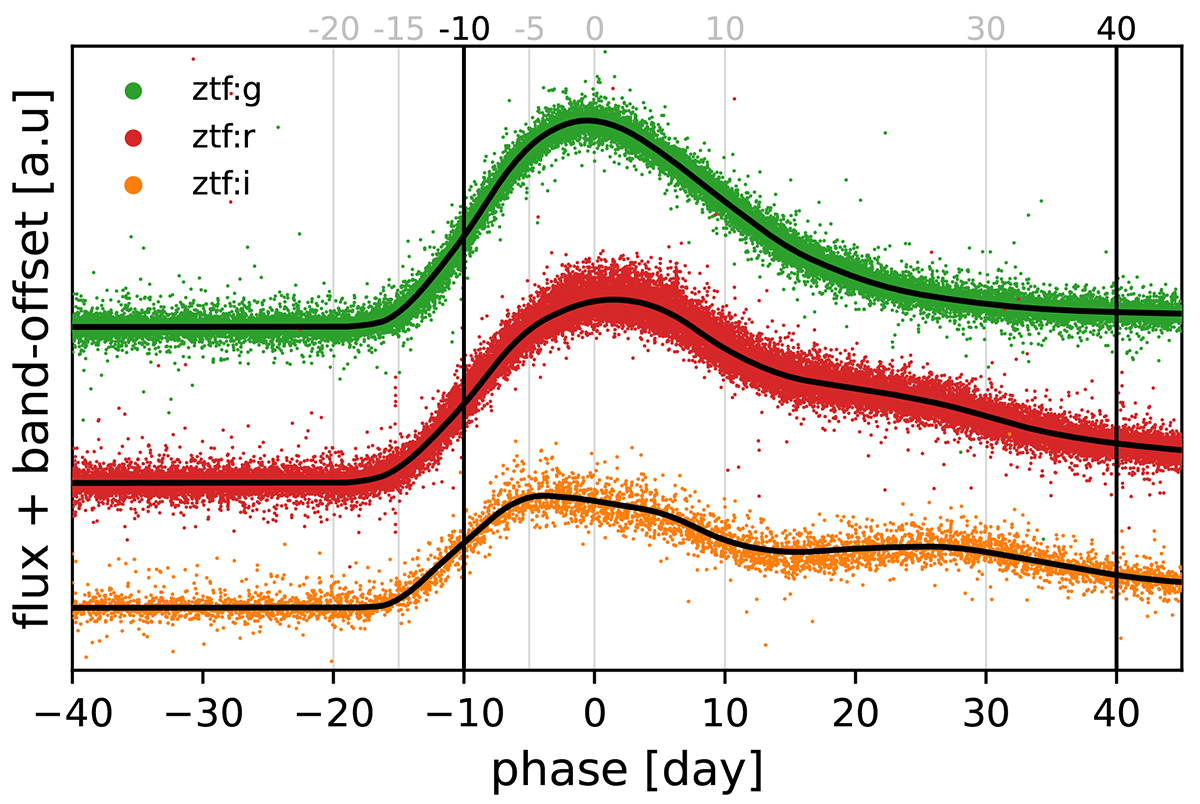
Example of Type Ia supernova light curves normalized by their SALT2 flux intensity parameter x0. For this illustration, only targets passing the following criteria are displayed (see Sect. 4.1): z ∈ [0.05, 0.09], c ∈ [−0.1, 0.1], and x1 ∈ [−1, 1]. In each panel, the black lines represent the SALT2 model at the median redshift (z = 0.07), color (c = 0.01), and stretch (x1 = 0.17). Bottom panels: Zoom on specific time periods illustrated by a given band. From top to bottom, early phases (g), near maximum light (r), and the second peak period (i) are shown. White markers show the daily bin median fluxes (quarter of a day for the early phases). This figure contains 781 SNe Ia.
Current usage metrics show cumulative count of Article Views (full-text article views including HTML views, PDF and ePub downloads, according to the available data) and Abstracts Views on Vision4Press platform.
Data correspond to usage on the plateform after 2015. The current usage metrics is available 48-96 hours after online publication and is updated daily on week days.
Initial download of the metrics may take a while.