Fig. 1.

Download original image
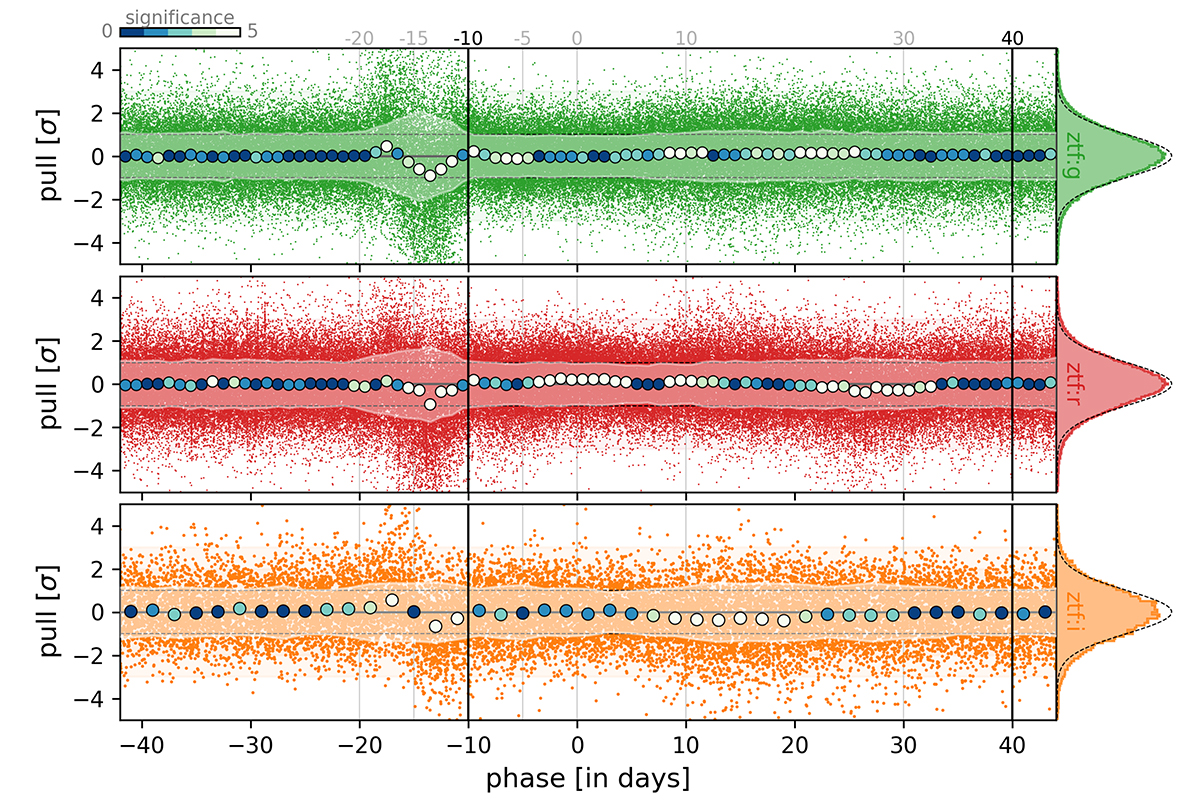
Best-fit light-curve residual in units of errors (i.e., the pull) as a function of rest-frame phase. From top to bottom, we show the g- (green), r- (red), and i-band (orange). The errors include the band-dependent error floor (see Sect. 3). In each panel, small colored markers represent individual data points (pull), and blue-to-white makers show the median pull per daily bin (2-d for i band). These markers are colored by the significance of their deviation from zero. White marker are nonzero at least at the 5σ level (see the top left significance color bar). The running white bands centered on zero show the bins for nMAD. If the light-curve model were to perfectly represent our data, and if our errors were Gaussian and correctly estimated, the pull should be centered on zero with a scatter of one. The thin dashed horizontal lines show the ±1σ for reference. The histograms in the right panel show the phase-marginalized distribution per band. An 𝒩(0, 1) distribution is also displayed as a thin dashed line for reference. The vertical black lines show the phase range used to fit the light-curve data phase ∈ [−10, +40] d. This figure contains 2625 SNe Ia.
Current usage metrics show cumulative count of Article Views (full-text article views including HTML views, PDF and ePub downloads, according to the available data) and Abstracts Views on Vision4Press platform.
Data correspond to usage on the plateform after 2015. The current usage metrics is available 48-96 hours after online publication and is updated daily on week days.
Initial download of the metrics may take a while.


