Fig. 4.
Download original image
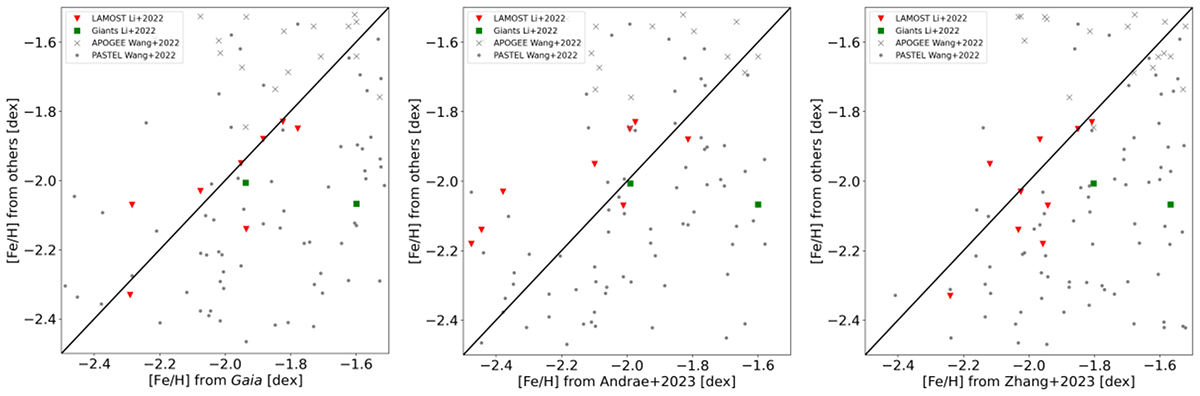
Comparison of metallicities from different catalogues. Left: comparison of the Gaia metallicities (x-axis) with the spectroscopic determinations of Li et al. (2022a,b), and Wang et al. (2022), shown as red triangles, green squares, and grey symbols, respectively. Middle: same as middle panel but comparing the spectroscopic metallicities with the determination from Andrae et al. (2023) on the x-axis. Right: same as other panels but with metallicities from Zhang et al. (2023) on the x-axis.
Current usage metrics show cumulative count of Article Views (full-text article views including HTML views, PDF and ePub downloads, according to the available data) and Abstracts Views on Vision4Press platform.
Data correspond to usage on the plateform after 2015. The current usage metrics is available 48-96 hours after online publication and is updated daily on week days.
Initial download of the metrics may take a while.