Fig. 5
Download original image
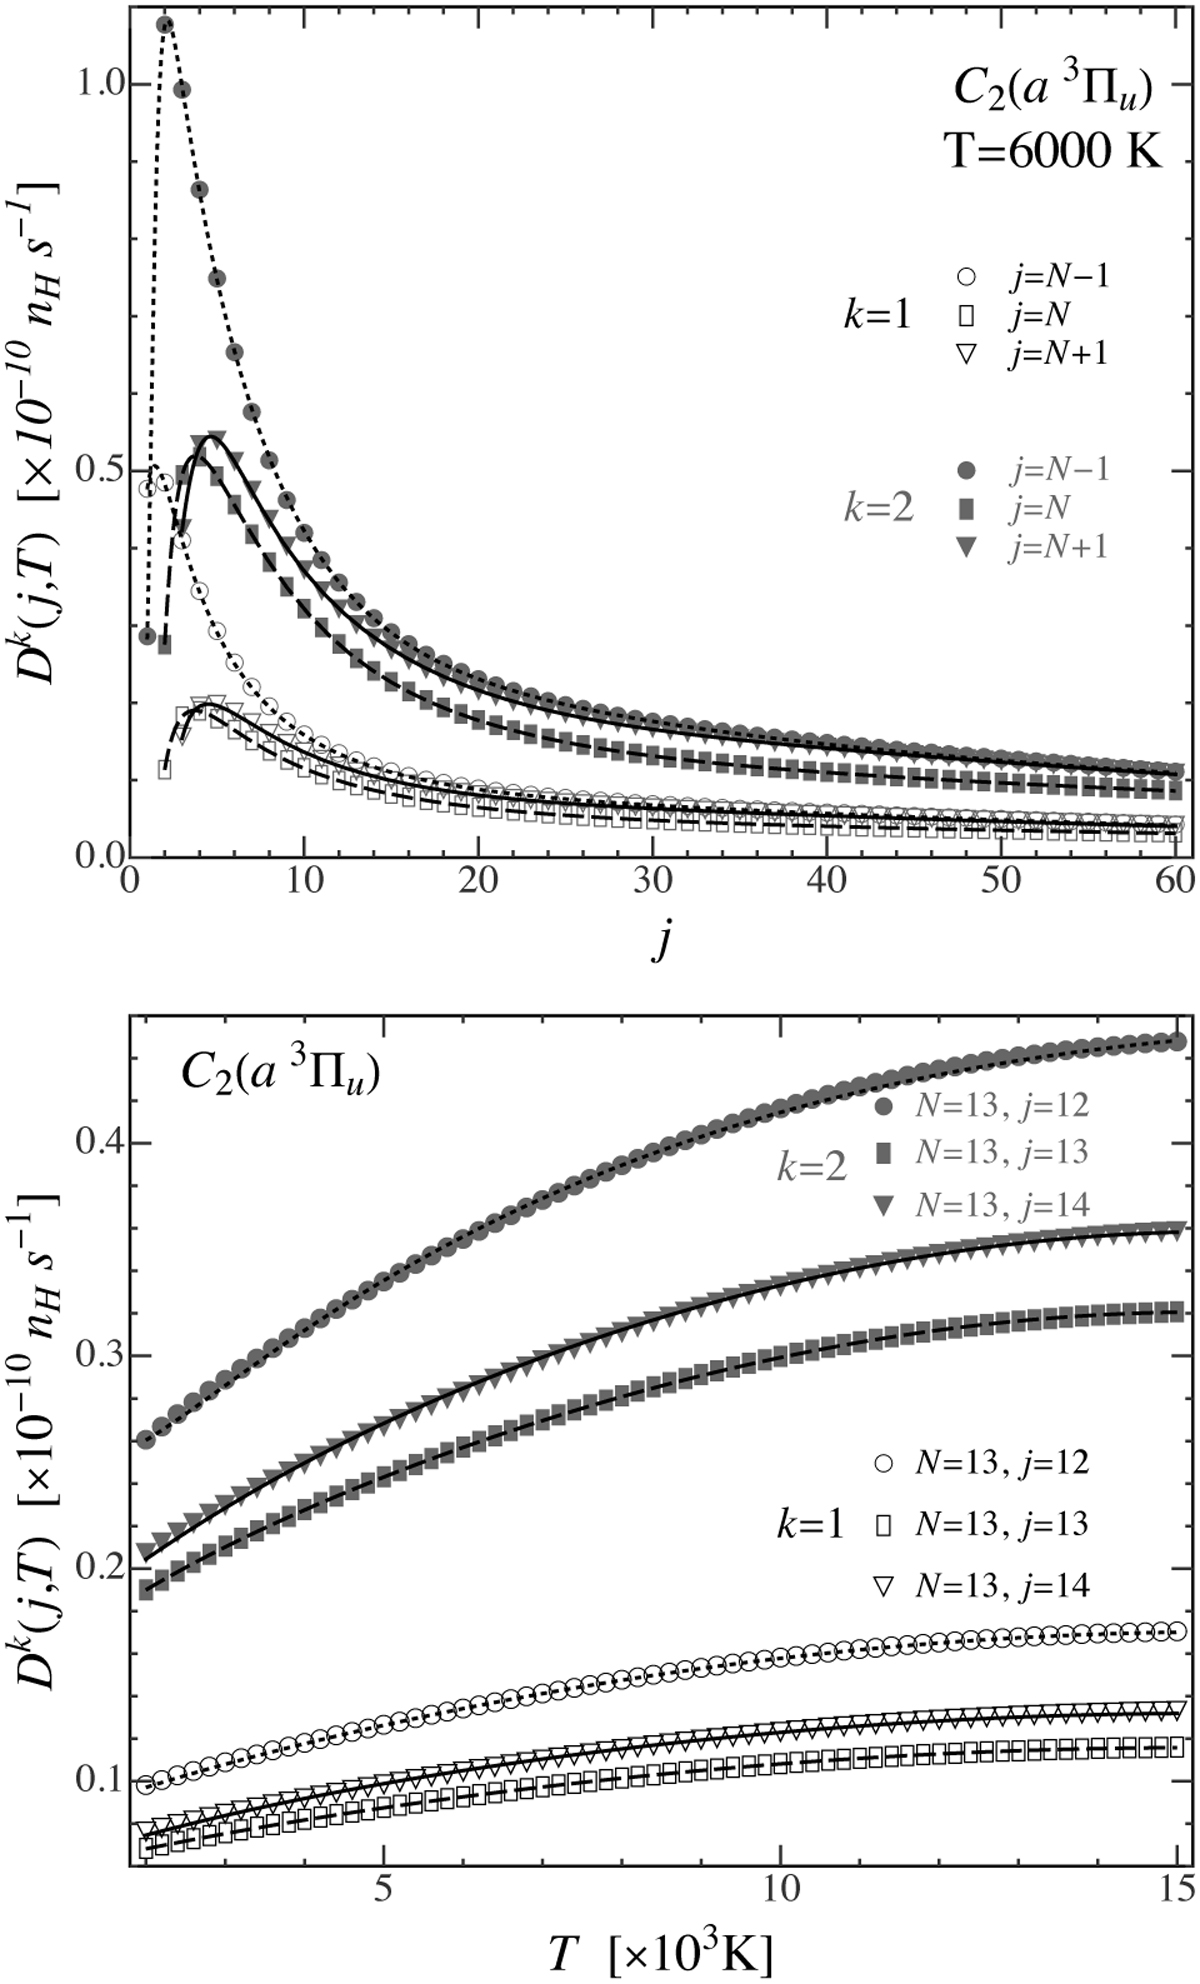
Collisonal depolarization rates, Dk(j, T), for C2 rotational levels in electronic states a3Πu. The upper panel illustrates the rates for k = 1 (open markers) and k = 2 (solid markers) with respect to j at T = 6000 K, where j = N−1 (circles), j = N (rectangles), and j = N +1 (triangles) are displayed. The lower panel shows the temperature variation in the rates for k = 1 (open markers) and k = 2 (solid markers) with the different j values of the N = 13 multiplet. Both panels display the fit values (dotted, dashed, and solid curves) we obtained using Equation (10) and GP coefficients of Tables A.3, A.4, and A.5.
Current usage metrics show cumulative count of Article Views (full-text article views including HTML views, PDF and ePub downloads, according to the available data) and Abstracts Views on Vision4Press platform.
Data correspond to usage on the plateform after 2015. The current usage metrics is available 48-96 hours after online publication and is updated daily on week days.
Initial download of the metrics may take a while.