Fig. 5
Download original image
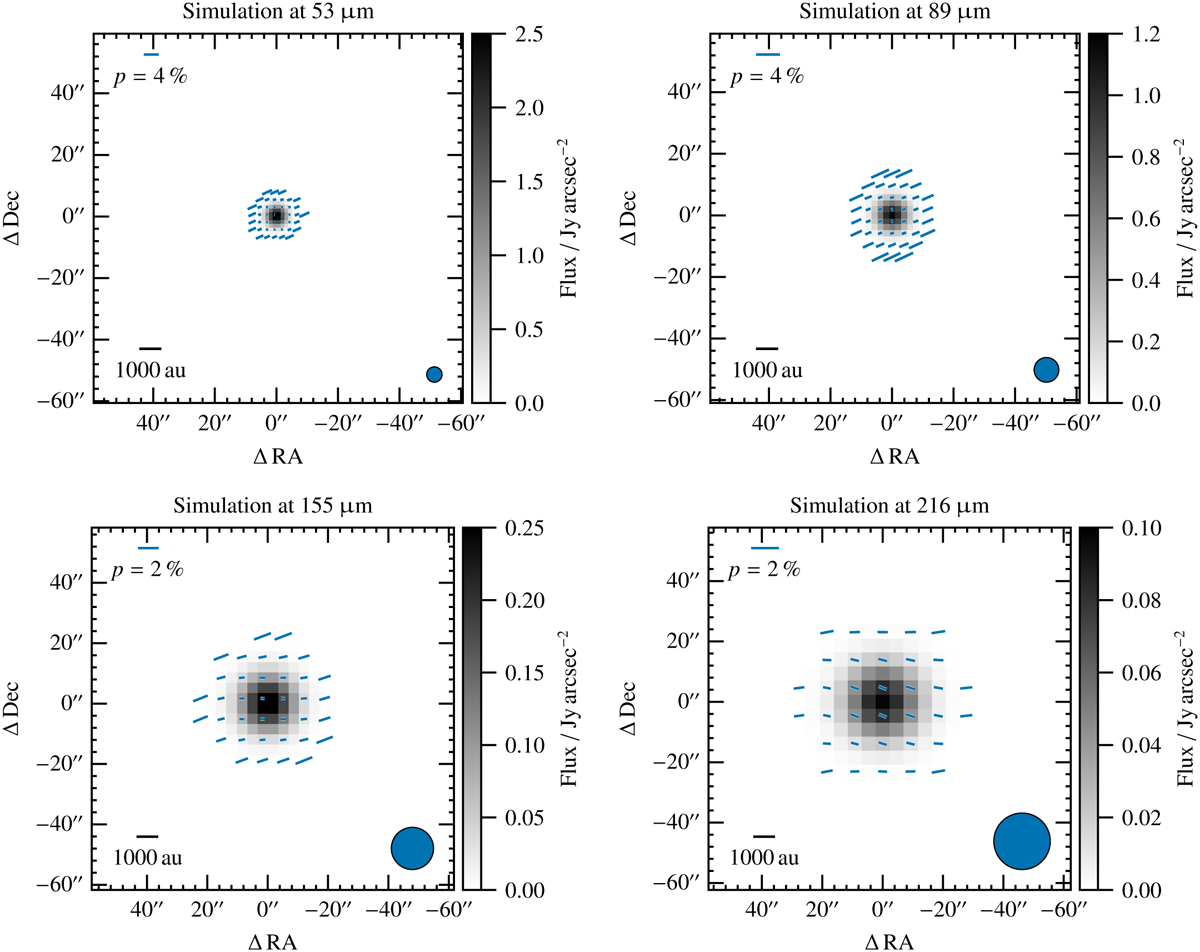
Simulated polarization maps based on the model described in Sect. 4.1 at 53 μm (top left), 89 μm (top right), 155 μm (bottom left), and 216 μm (bottom right). The surface brightness (gray scale) is given in units of Jy arcsec−2 and is overlaid with polarization vectors in blue. The length and orientation of the vectors give the degree and angle of polarization, respectively. In contrast to the observational criteria, only vectors where I/Imax > 10−3 and p > 0.1 % are shown. The beam size (FWHM) at each corresponding SOFIA/HAWC+ wavelength band is indicated in the respective lower right corner. The scale bar (1000 au) corresponds to an assumed distance of HL Tau of 140 pc. The images are cropped to an image size of 2 arcmin × 2 arcmin. See Sect. 4.5 for details.
Current usage metrics show cumulative count of Article Views (full-text article views including HTML views, PDF and ePub downloads, according to the available data) and Abstracts Views on Vision4Press platform.
Data correspond to usage on the plateform after 2015. The current usage metrics is available 48-96 hours after online publication and is updated daily on week days.
Initial download of the metrics may take a while.