Fig. 3
Download original image
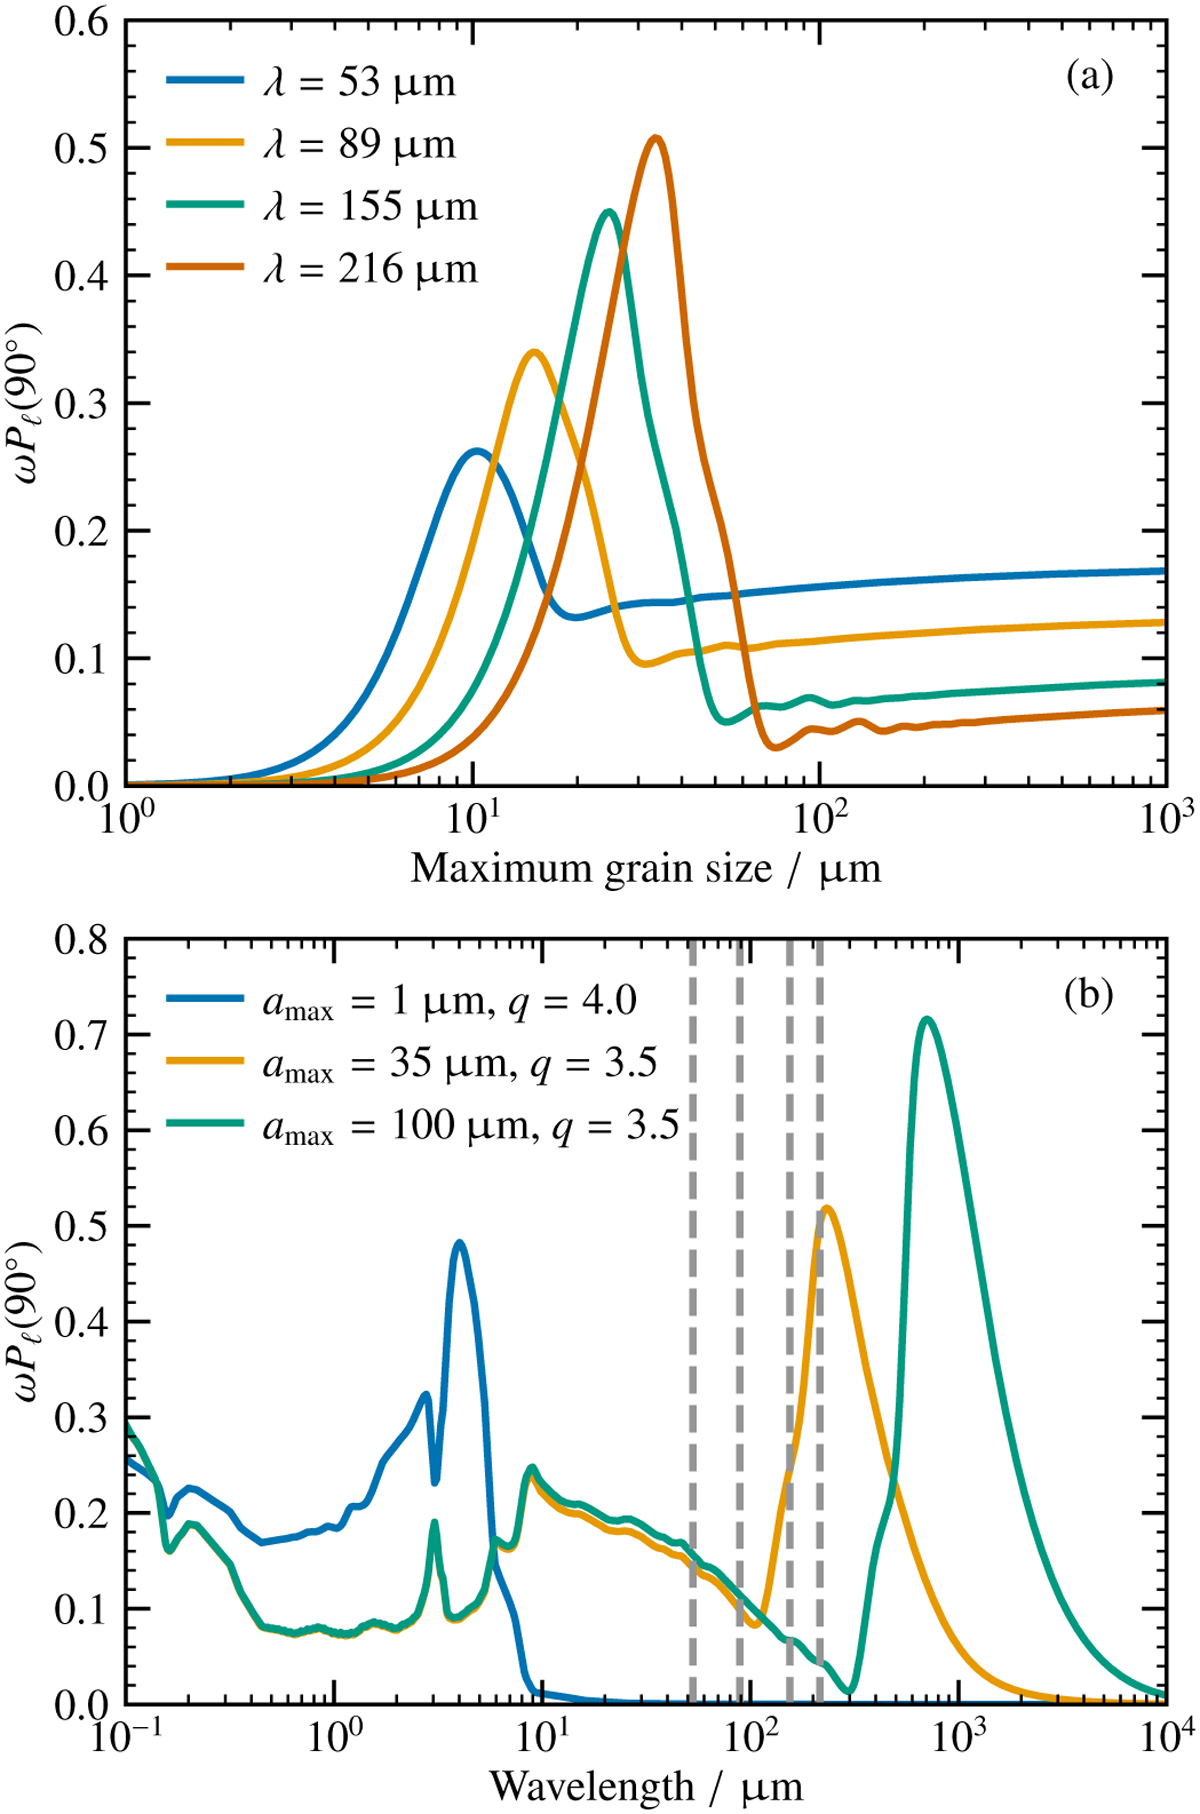
Single scattering albedo ω times the single scattering polarization degree Pℓ at a scattering angle of 90° as a function of maximum grain size (top) and wavelength (bottom). In the top figure (a), the different line colors represent the four central wavelengths of the SOFIA/HAWC+ bands A, C, D, and E. The size distribution is described by Eq. (9) with an exponent of q = 3.5. In the bottom figure (b), the different line colors represent the case of different maximum grain sizes amax and exponents q of the size distribution. The gray dashed vertical lines indicate the central wavelength of the SOFIA/HAWC+ bands A, C, D, and E. See Sect. 4.2 for details.
Current usage metrics show cumulative count of Article Views (full-text article views including HTML views, PDF and ePub downloads, according to the available data) and Abstracts Views on Vision4Press platform.
Data correspond to usage on the plateform after 2015. The current usage metrics is available 48-96 hours after online publication and is updated daily on week days.
Initial download of the metrics may take a while.