Fig. 7.

Download original image
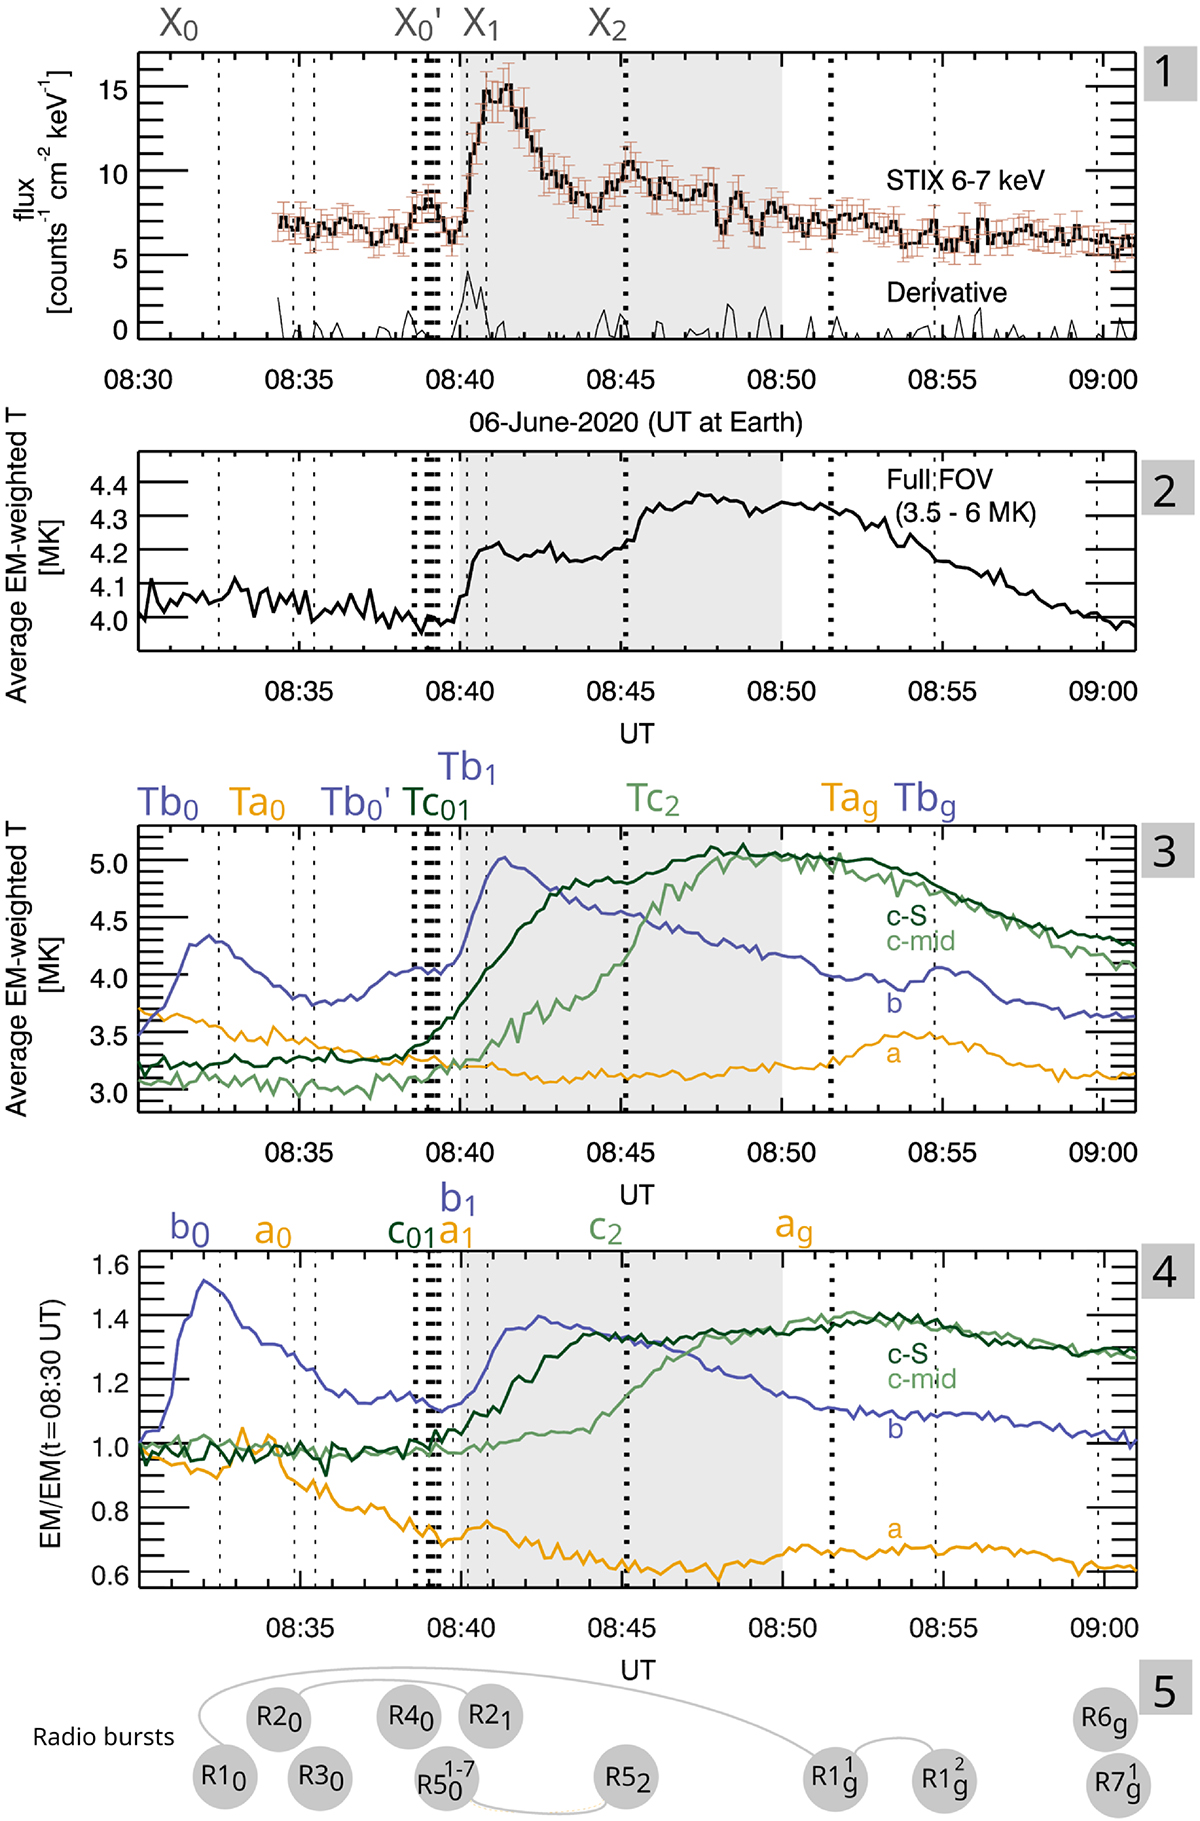
Temporal evolution of the B1 flare of 6 June 2020 as seen in X-ray fluxes, average temperatures of sub-regions and timing of radio bursts. X-ray fluxes in the range 6 keV–7 keV are characterized by several peaks labeled with X0 to X2 (panel 1). The time axis was corrected for the light travel time. The timing of type-III bursts (dashed lines and panel 5) are shown in all panels. Radio bursts with fluxes above 10 SFU are displayed in bold line styles. Average temperatures of the AR based on the DEM reconstruction (panel 2). Temperature (panel 3) and EM evolution (panel 4) of the sub-regions (Fig. 5).
Current usage metrics show cumulative count of Article Views (full-text article views including HTML views, PDF and ePub downloads, according to the available data) and Abstracts Views on Vision4Press platform.
Data correspond to usage on the plateform after 2015. The current usage metrics is available 48-96 hours after online publication and is updated daily on week days.
Initial download of the metrics may take a while.


