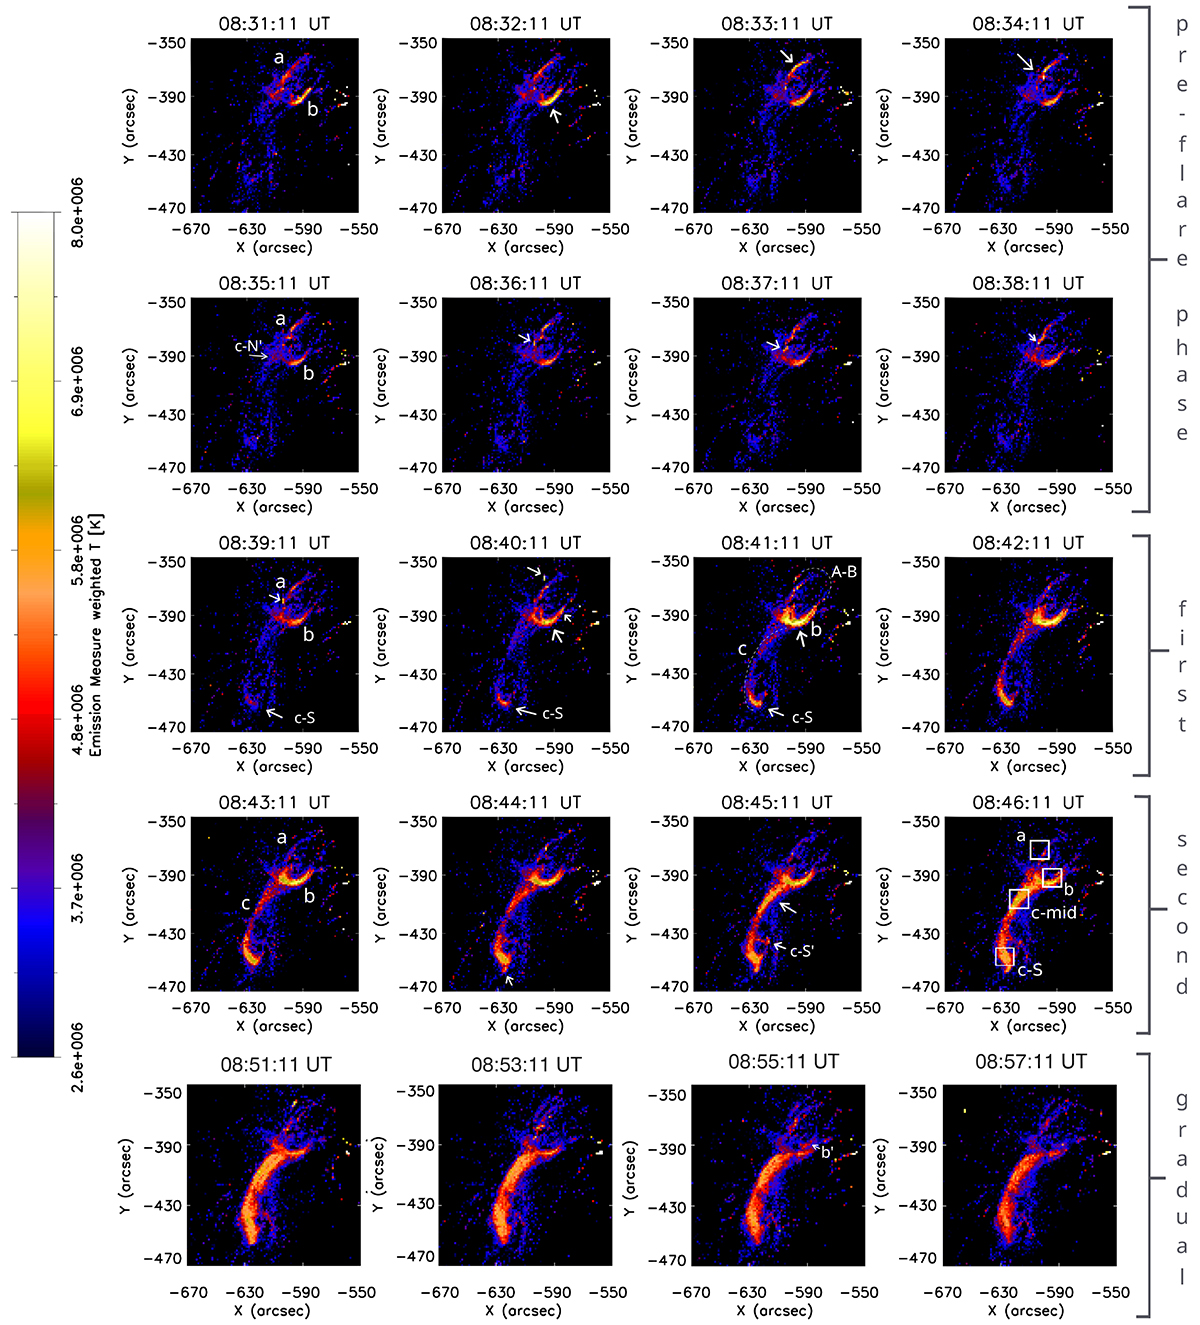
Fig. 5.
Download original image
Evolution of the core loops of the AR as seen in the EM-weighted temperature maps. Changes and important structures are marked with white arrows. The influence of the flare on the AR can be especially seen at 08:41 UT (loop b reaches temperature of 7 MK in the first flare phase) and at 08:45 UT (loop c is strongly heated during the second impulsive flare phase). White boxes in the image at 08:46:11 UT are the sub-regions for the temperature analysis (Fig. 7).
Current usage metrics show cumulative count of Article Views (full-text article views including HTML views, PDF and ePub downloads, according to the available data) and Abstracts Views on Vision4Press platform.
Data correspond to usage on the plateform after 2015. The current usage metrics is available 48-96 hours after online publication and is updated daily on week days.
Initial download of the metrics may take a while.