Fig. 4.
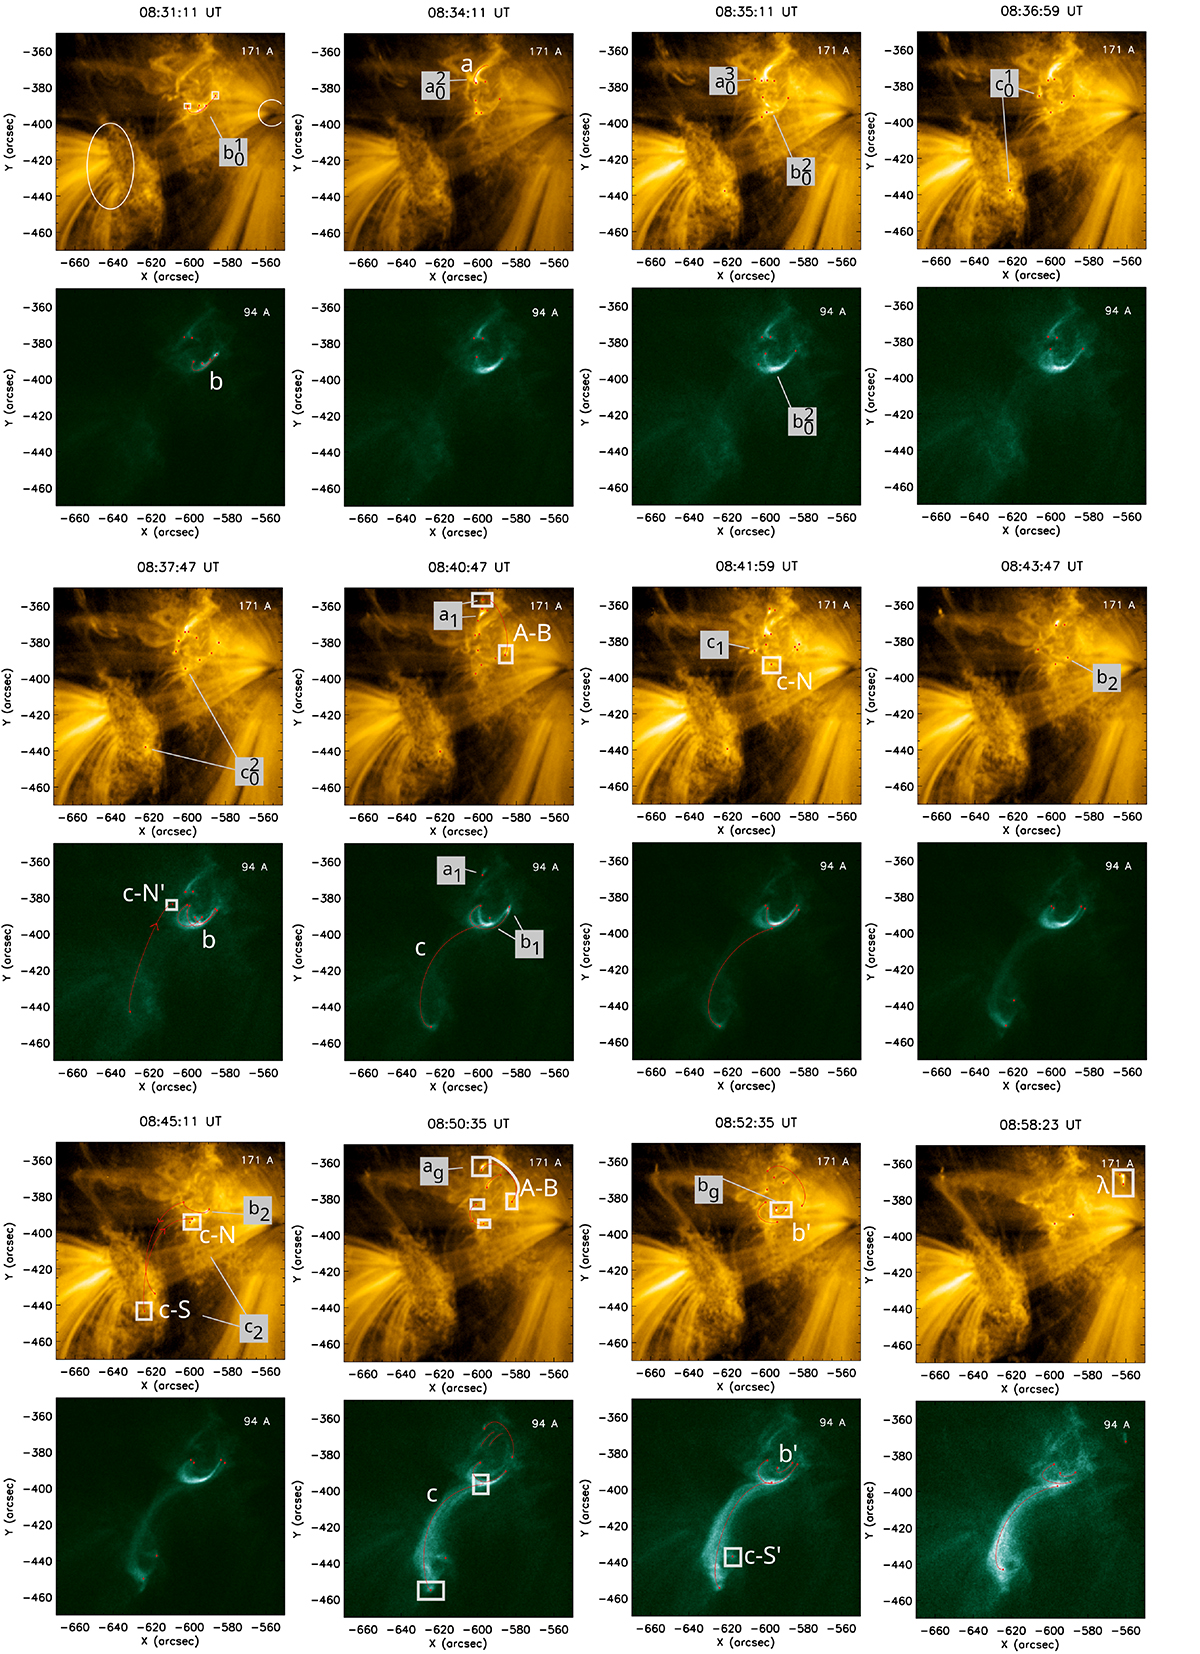
Download original image
AIA observations in 171 Å and 94 Å of the small-scale AR with the main loops a, b, c, and A-B. White circles indicate the foot points of the overlaying M and L loops (Fig. 2). Enhancements of intensities are marked with red dots and white boxes. These highlight foot points and loop-tops of the suddenly changing loops. Red arrows show the orientation of the loops based on the polarity of their foot points (HMI data, Fig. 2). The associated movie is available online.
Current usage metrics show cumulative count of Article Views (full-text article views including HTML views, PDF and ePub downloads, according to the available data) and Abstracts Views on Vision4Press platform.
Data correspond to usage on the plateform after 2015. The current usage metrics is available 48-96 hours after online publication and is updated daily on week days.
Initial download of the metrics may take a while.