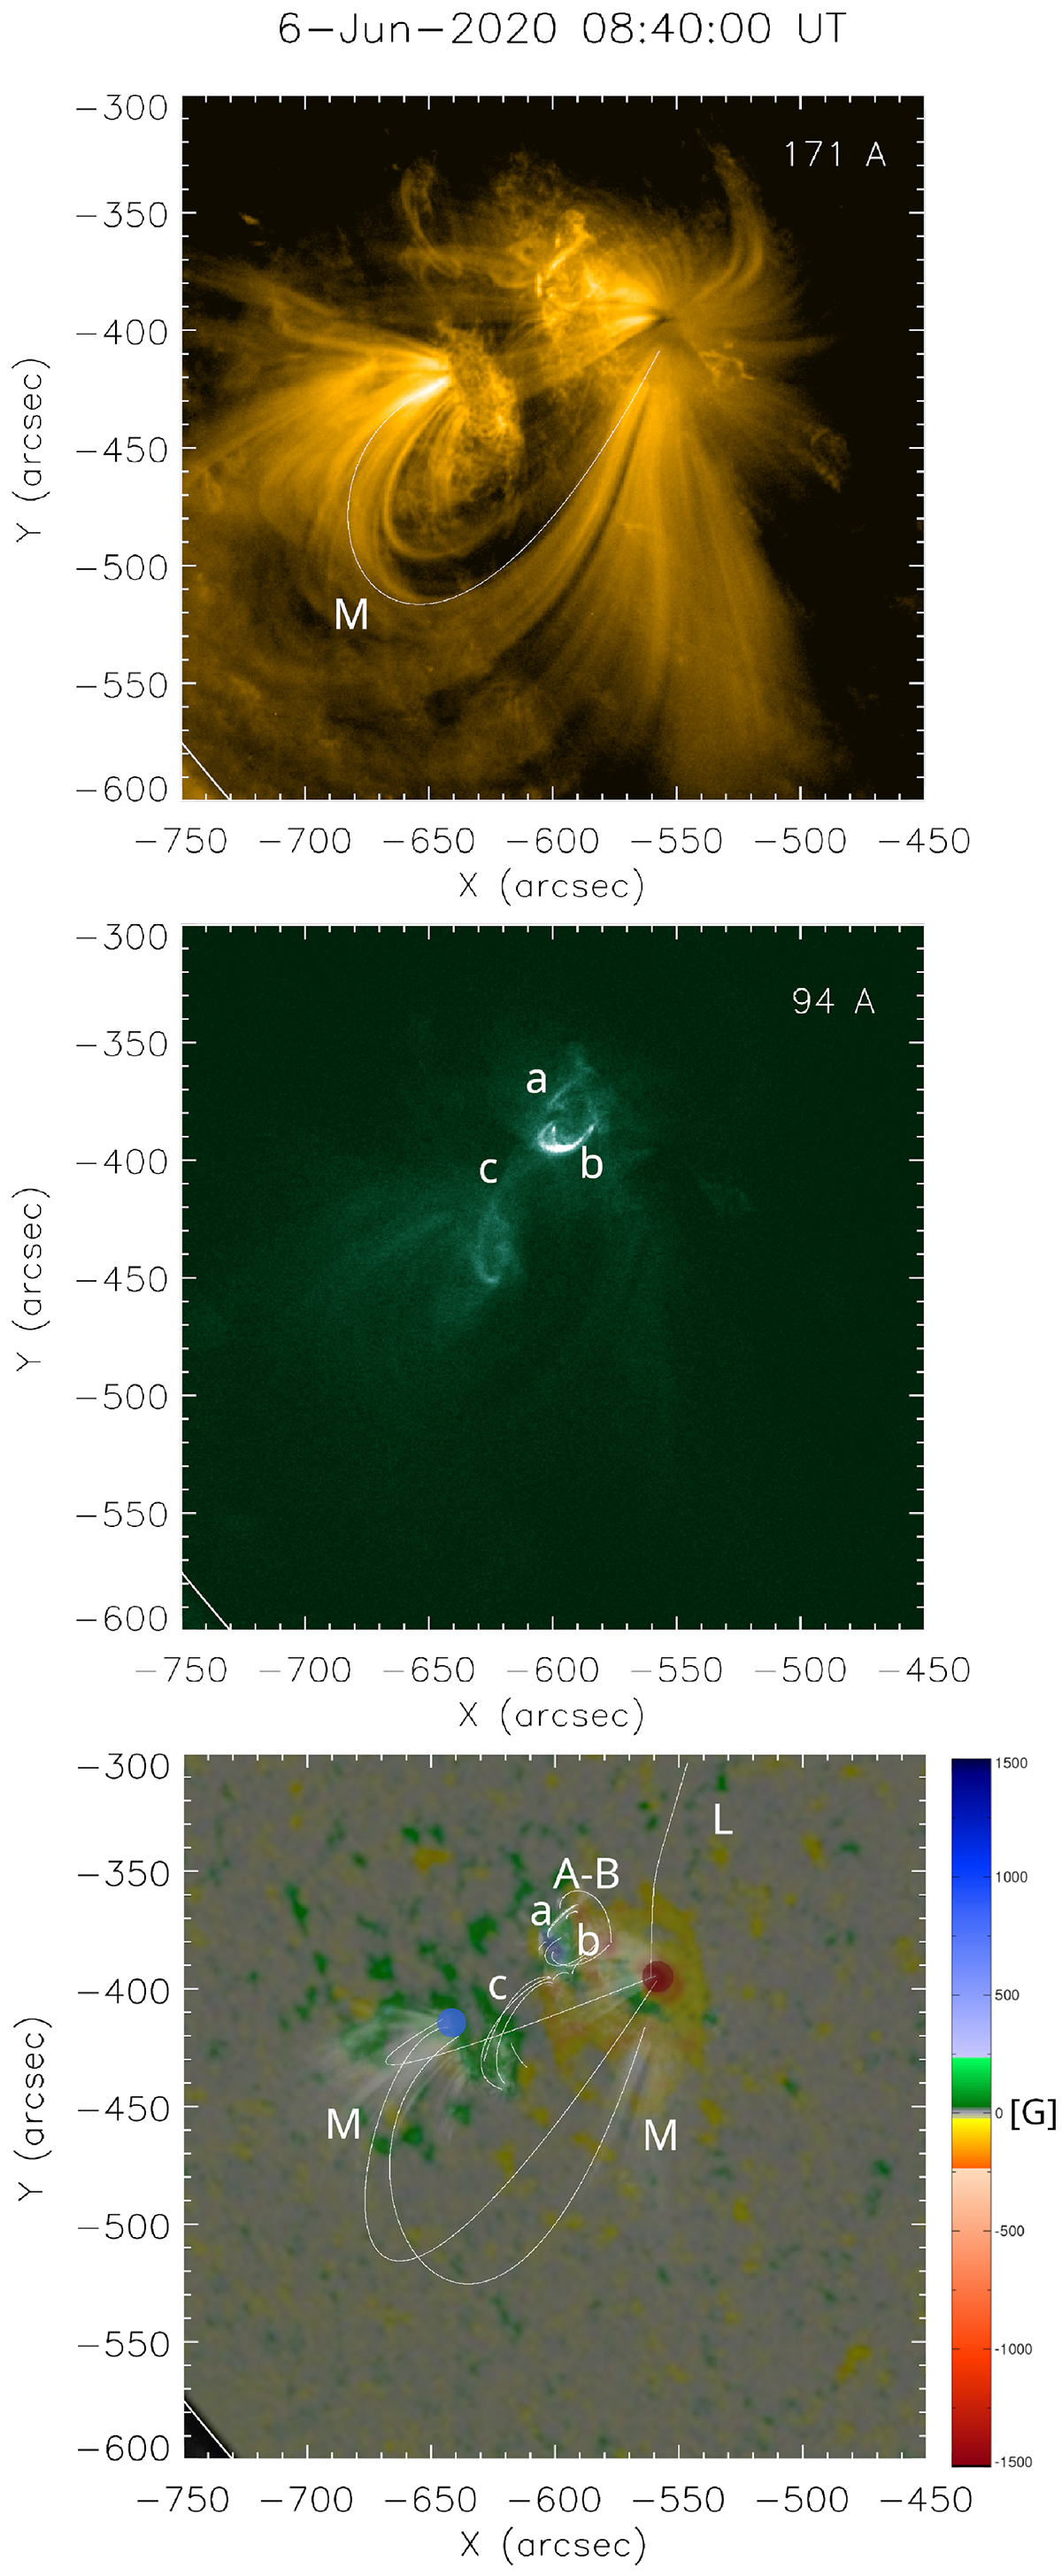
Fig. 2.
Download original image
AIA observations in two channels and HMI data show the coronal loops of the AR with different sizes and magnetic polarities. Top panel: Magnetic field lines in channel 171 Å. Middle panel: Magnetic field lines in channel 94 Å. This channel shows mainly the small-scale loops of the AR. Larger loops with lower temperatures are only faintly visible. Bottom panel: Colorized magnetogram based on HMI data showing the different polarities of the AR. The overlaid illustrations of possible loops were identified by eye from the AIA observations.
Current usage metrics show cumulative count of Article Views (full-text article views including HTML views, PDF and ePub downloads, according to the available data) and Abstracts Views on Vision4Press platform.
Data correspond to usage on the plateform after 2015. The current usage metrics is available 48-96 hours after online publication and is updated daily on week days.
Initial download of the metrics may take a while.