Open Access
Fig. 10.
Download original image
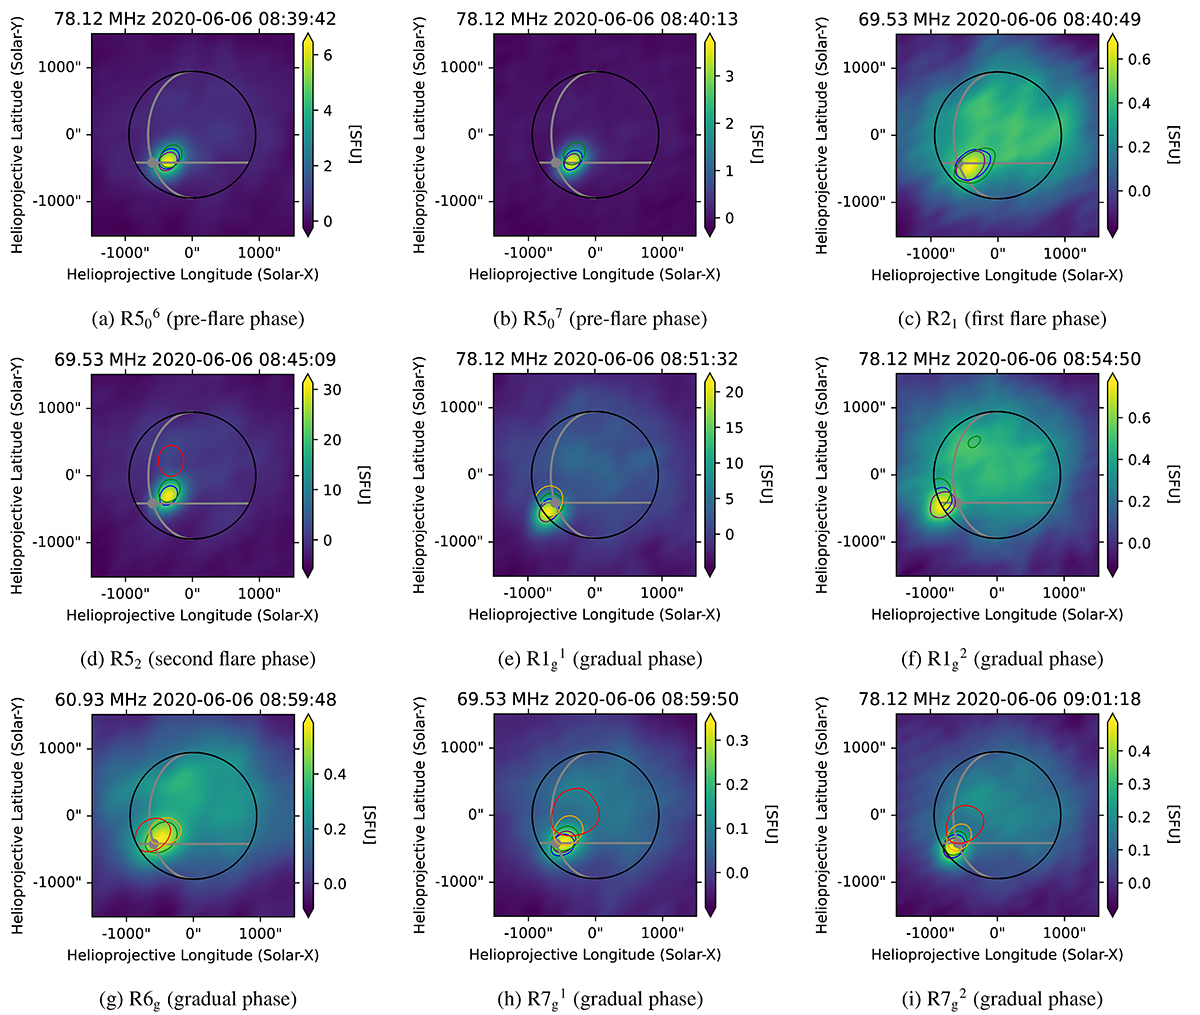
Type-III radio source positions for burst R506 to R7g2 (flare phases are noted in the sub-captions). The colors of the contours correspond to their frequency, namely 80 MHz (purple), 70 MHz (blue), 60 MHz (green), 50 MHz (orange) and 40 MHz (red). The gray lines are the lines of longitude and latitude of the AR.
Current usage metrics show cumulative count of Article Views (full-text article views including HTML views, PDF and ePub downloads, according to the available data) and Abstracts Views on Vision4Press platform.
Data correspond to usage on the plateform after 2015. The current usage metrics is available 48-96 hours after online publication and is updated daily on week days.
Initial download of the metrics may take a while.