Open Access
Fig. 7
Download original image
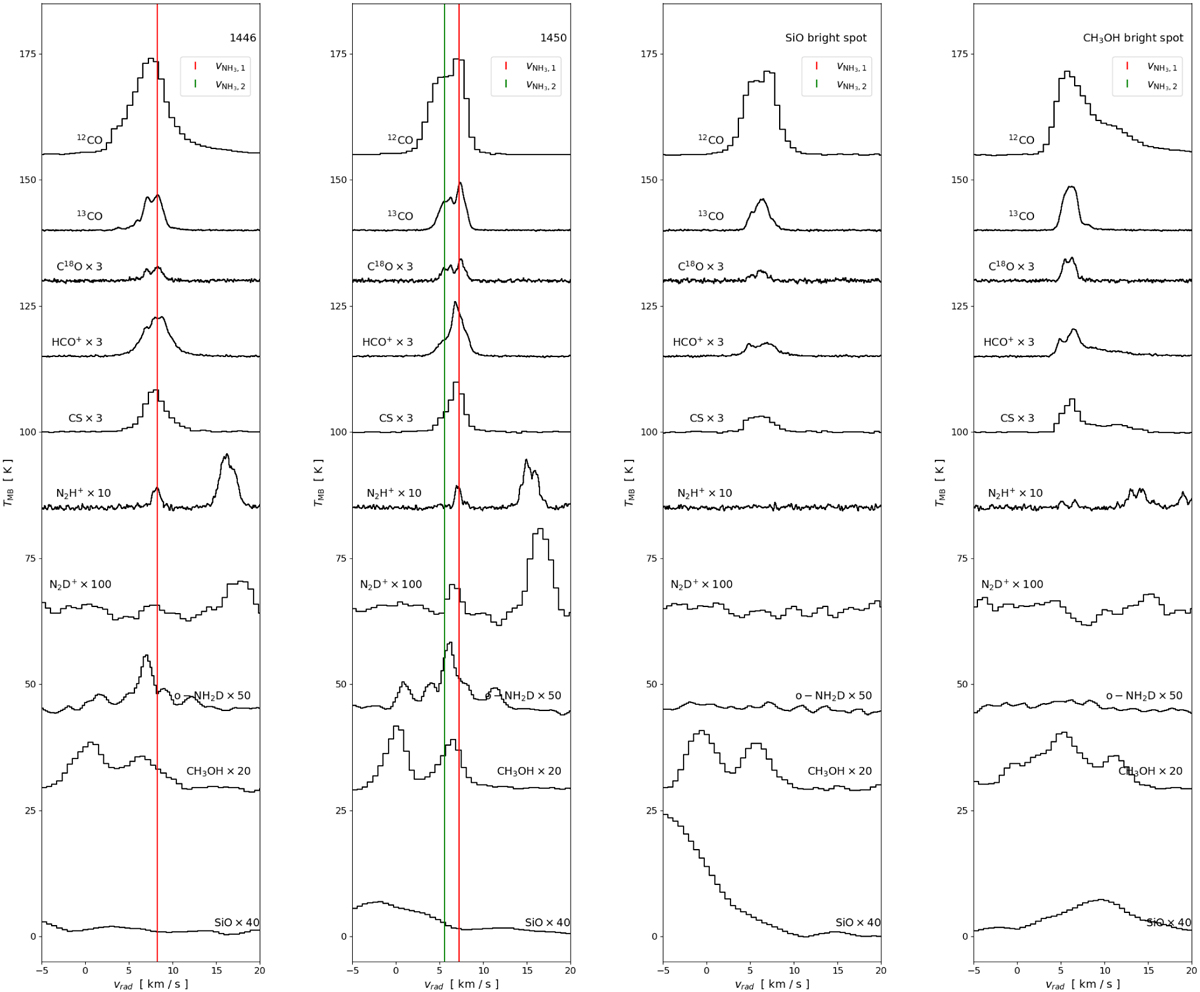
Spectra of the observations to the GCC sources 1446 and 1450, and to the coordinates of the brightest SiO and CH3 OH emission, as indicated in the top-right corner of each frame. The red and green vertical lines denote the velocities of the NH3 (1,1) first (stronger) and second (weaker) components, respectively.
Current usage metrics show cumulative count of Article Views (full-text article views including HTML views, PDF and ePub downloads, according to the available data) and Abstracts Views on Vision4Press platform.
Data correspond to usage on the plateform after 2015. The current usage metrics is available 48-96 hours after online publication and is updated daily on week days.
Initial download of the metrics may take a while.