Fig. 6
Download original image
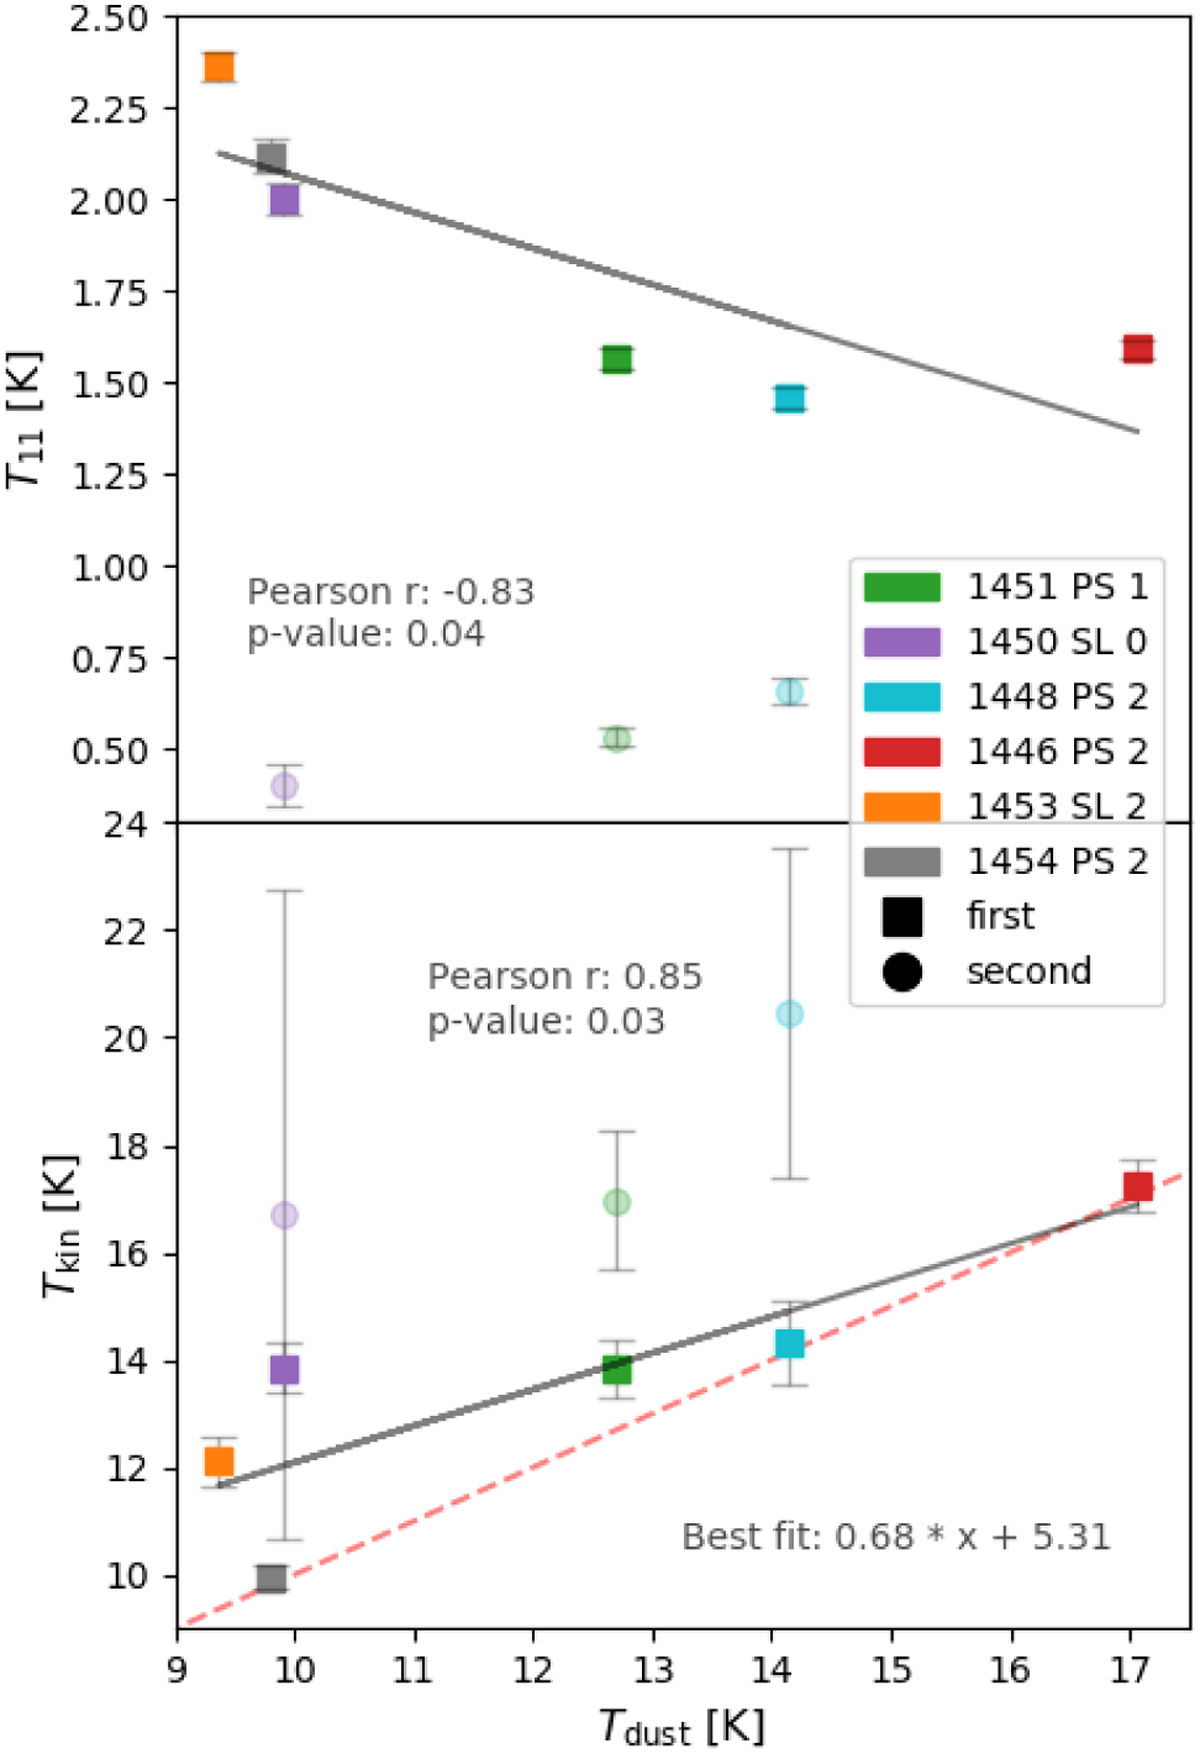
Relationship between temperatures derived from NH3 and dust temperature. Top: NH3 (1,1) main beam temperature as a function of dust temperature (Montillaud et al. 2015). Bottom: kinetic temperature as a function of dust temperature. The red dashed line marks the 1–1 correlation line. The grey line of the least square fit slope is far from 1, two sources with dust temperatures below 10 K have significantly higher kinetic temperatures. The legend is the same as in Fig. 5.
Current usage metrics show cumulative count of Article Views (full-text article views including HTML views, PDF and ePub downloads, according to the available data) and Abstracts Views on Vision4Press platform.
Data correspond to usage on the plateform after 2015. The current usage metrics is available 48-96 hours after online publication and is updated daily on week days.
Initial download of the metrics may take a while.