Fig. 4
Download original image
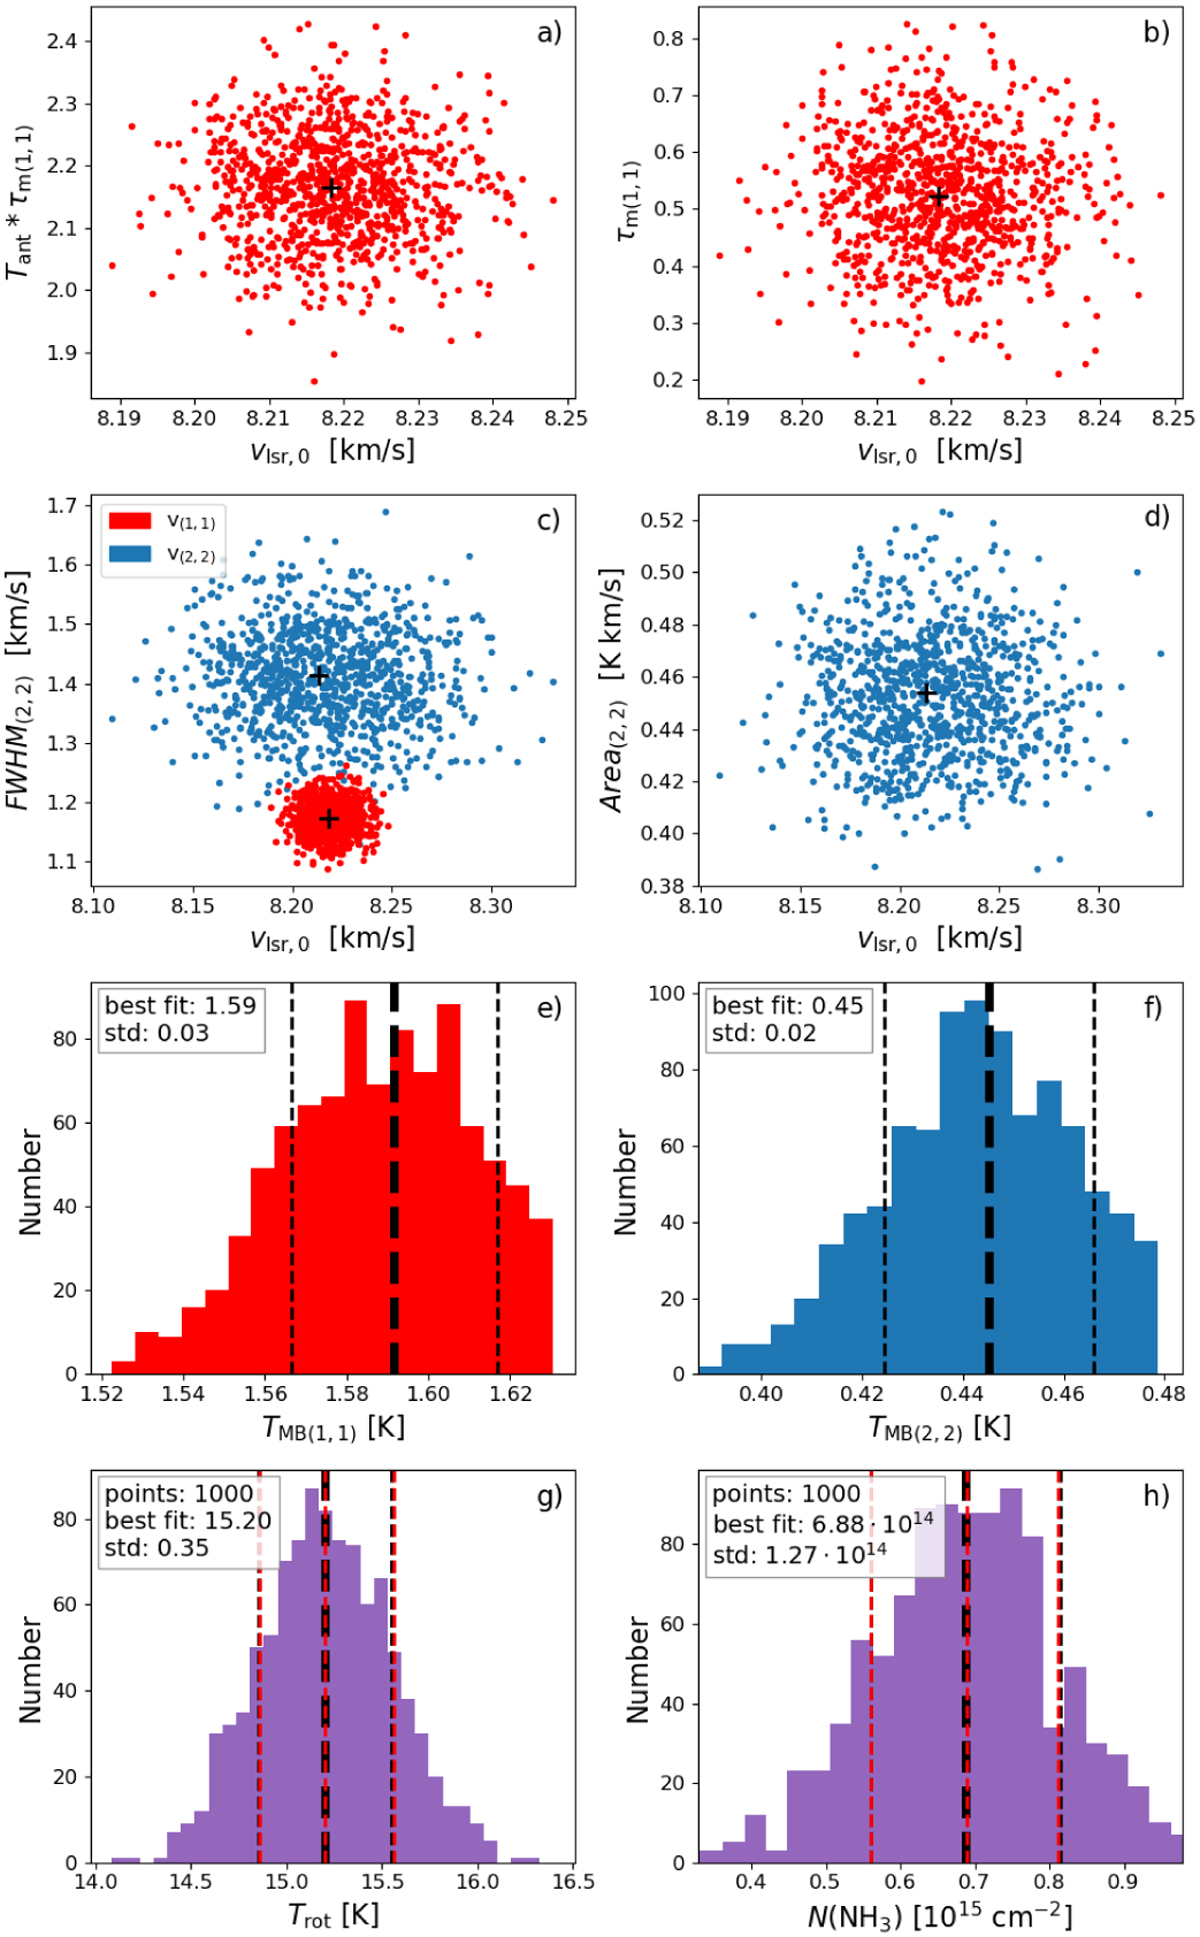
Results of the MC simulations for 1446. Frames a, b and c show parameters obtained for the NH3 (1,1) line, c and d for the (2,2) line. Frames e and f show the distribution obtained for main beam brightness temperature, TMB(1, 1) and TMB(2, 2), g for rotational temperature and h for the NH3 column density. Black crosses mark the values obtained from the CLASS fitting. The black thick dashed lines show the values obtained with the best fit parameter, the black thin dashed lines show the standard deviation, and the red dashed lines indicate the 16th, 50th, and 84th percentiles.
Current usage metrics show cumulative count of Article Views (full-text article views including HTML views, PDF and ePub downloads, according to the available data) and Abstracts Views on Vision4Press platform.
Data correspond to usage on the plateform after 2015. The current usage metrics is available 48-96 hours after online publication and is updated daily on week days.
Initial download of the metrics may take a while.