Fig. 2
Download original image
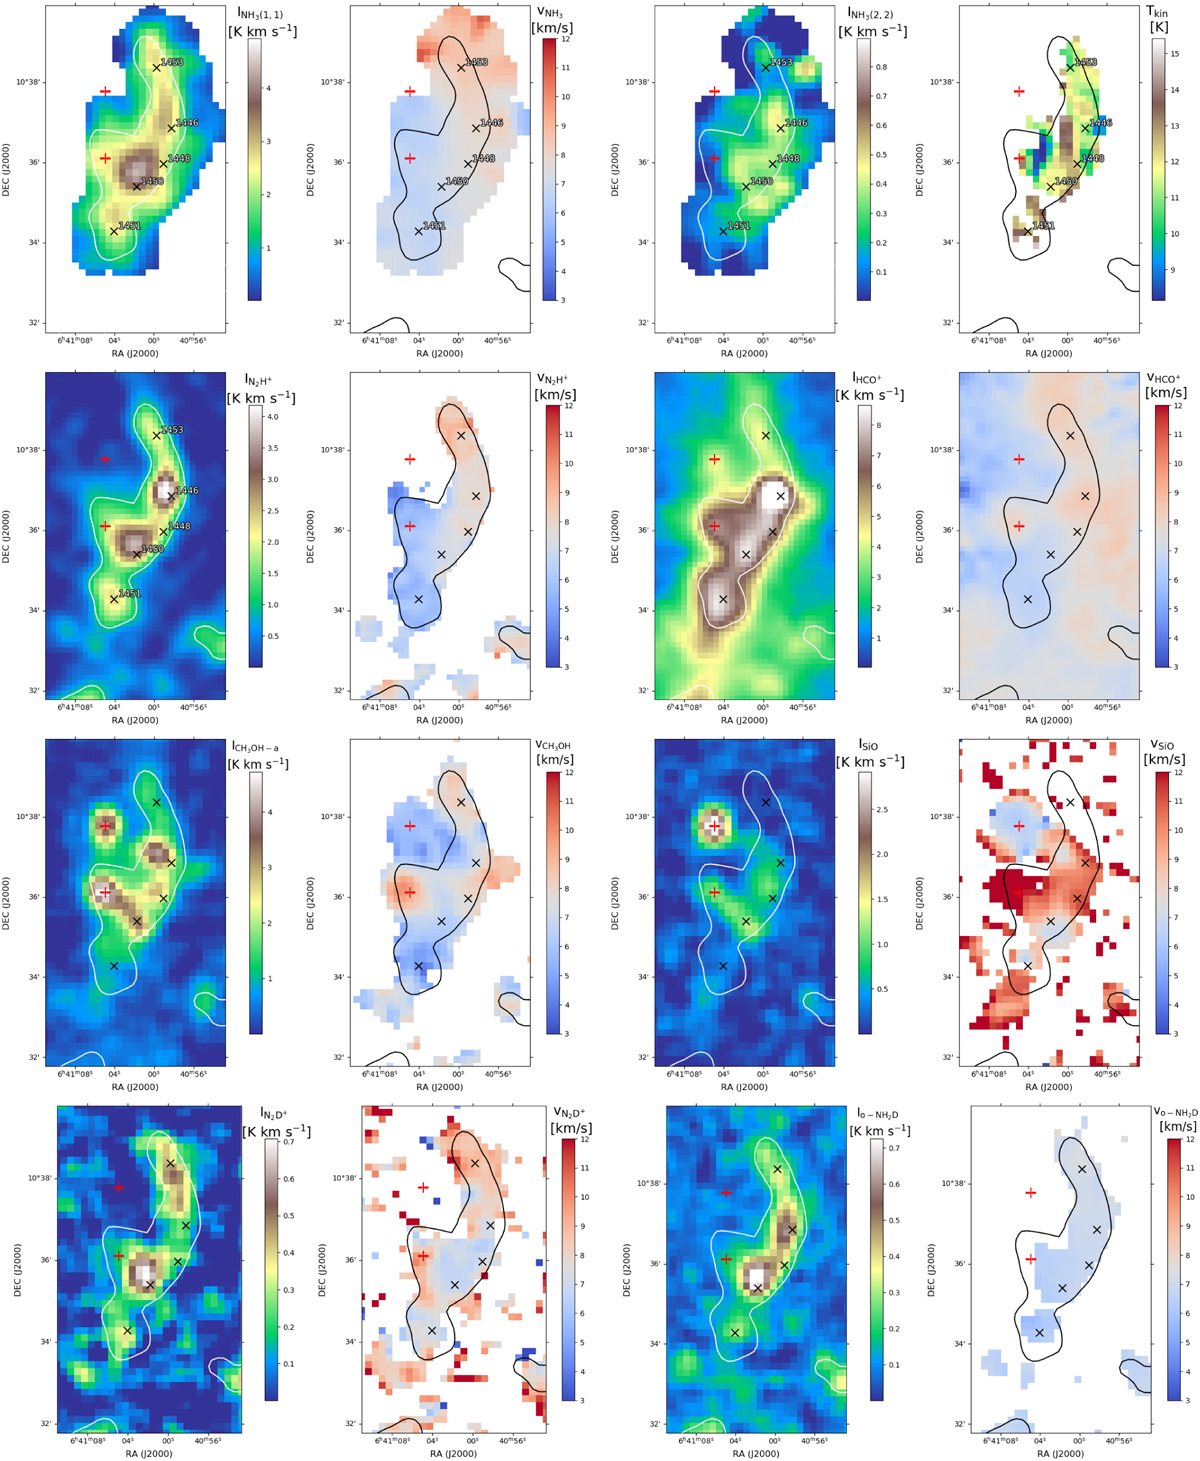
NH3 (1,1) integrated intensity and first moment maps, NH3 (2,2) integrated intensity and kinetic temperature maps, N2H+, HCO+, CH3OH, SiO, N2D+, and o-NH2 D integrated intensity and first moment maps (from top left to bottom right). The white contours on the intensity maps and the black contours on the velocity maps mark N2H+ intensity contours at 1 K km s−1. The black crosses mark the compact sources from the GCC catalogue. The red crosses mark the brightest spots in SiO (northern) and CH3OH (southern).
Current usage metrics show cumulative count of Article Views (full-text article views including HTML views, PDF and ePub downloads, according to the available data) and Abstracts Views on Vision4Press platform.
Data correspond to usage on the plateform after 2015. The current usage metrics is available 48-96 hours after online publication and is updated daily on week days.
Initial download of the metrics may take a while.