Fig. 14
Download original image
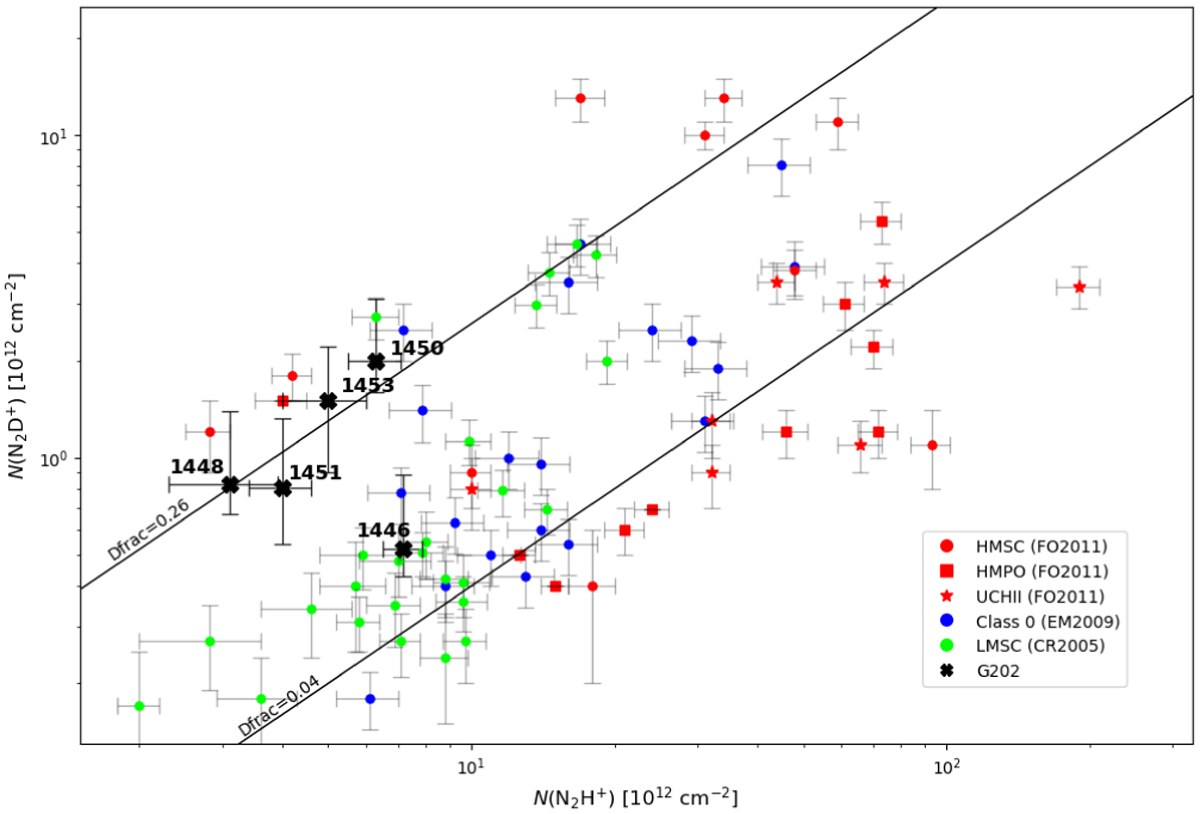
N2D+ column density versus N2H+ column density. Red symbols denote high mass starless cores (HMSCs), high mass protostellar objects (HMPOs), and ultracompact HII regions (UCHIIs) from Fontani et al. (2011), blue circles denote Class 0 objects from Emprechtinger et al. (2009), and green circles denote low mass starless cores from Crapsi et al. (2005). Our sample is indicated with thick black crosses. The two solid black lines indicate Dfrac values of 0.26 (average Dfrac of the HMSC group) and 0.04 (average Dfrac of the HMPO and UCHII groups), similarly to Fig. 1 of Fontani et al. (2011) to aid comparison.
Current usage metrics show cumulative count of Article Views (full-text article views including HTML views, PDF and ePub downloads, according to the available data) and Abstracts Views on Vision4Press platform.
Data correspond to usage on the plateform after 2015. The current usage metrics is available 48-96 hours after online publication and is updated daily on week days.
Initial download of the metrics may take a while.