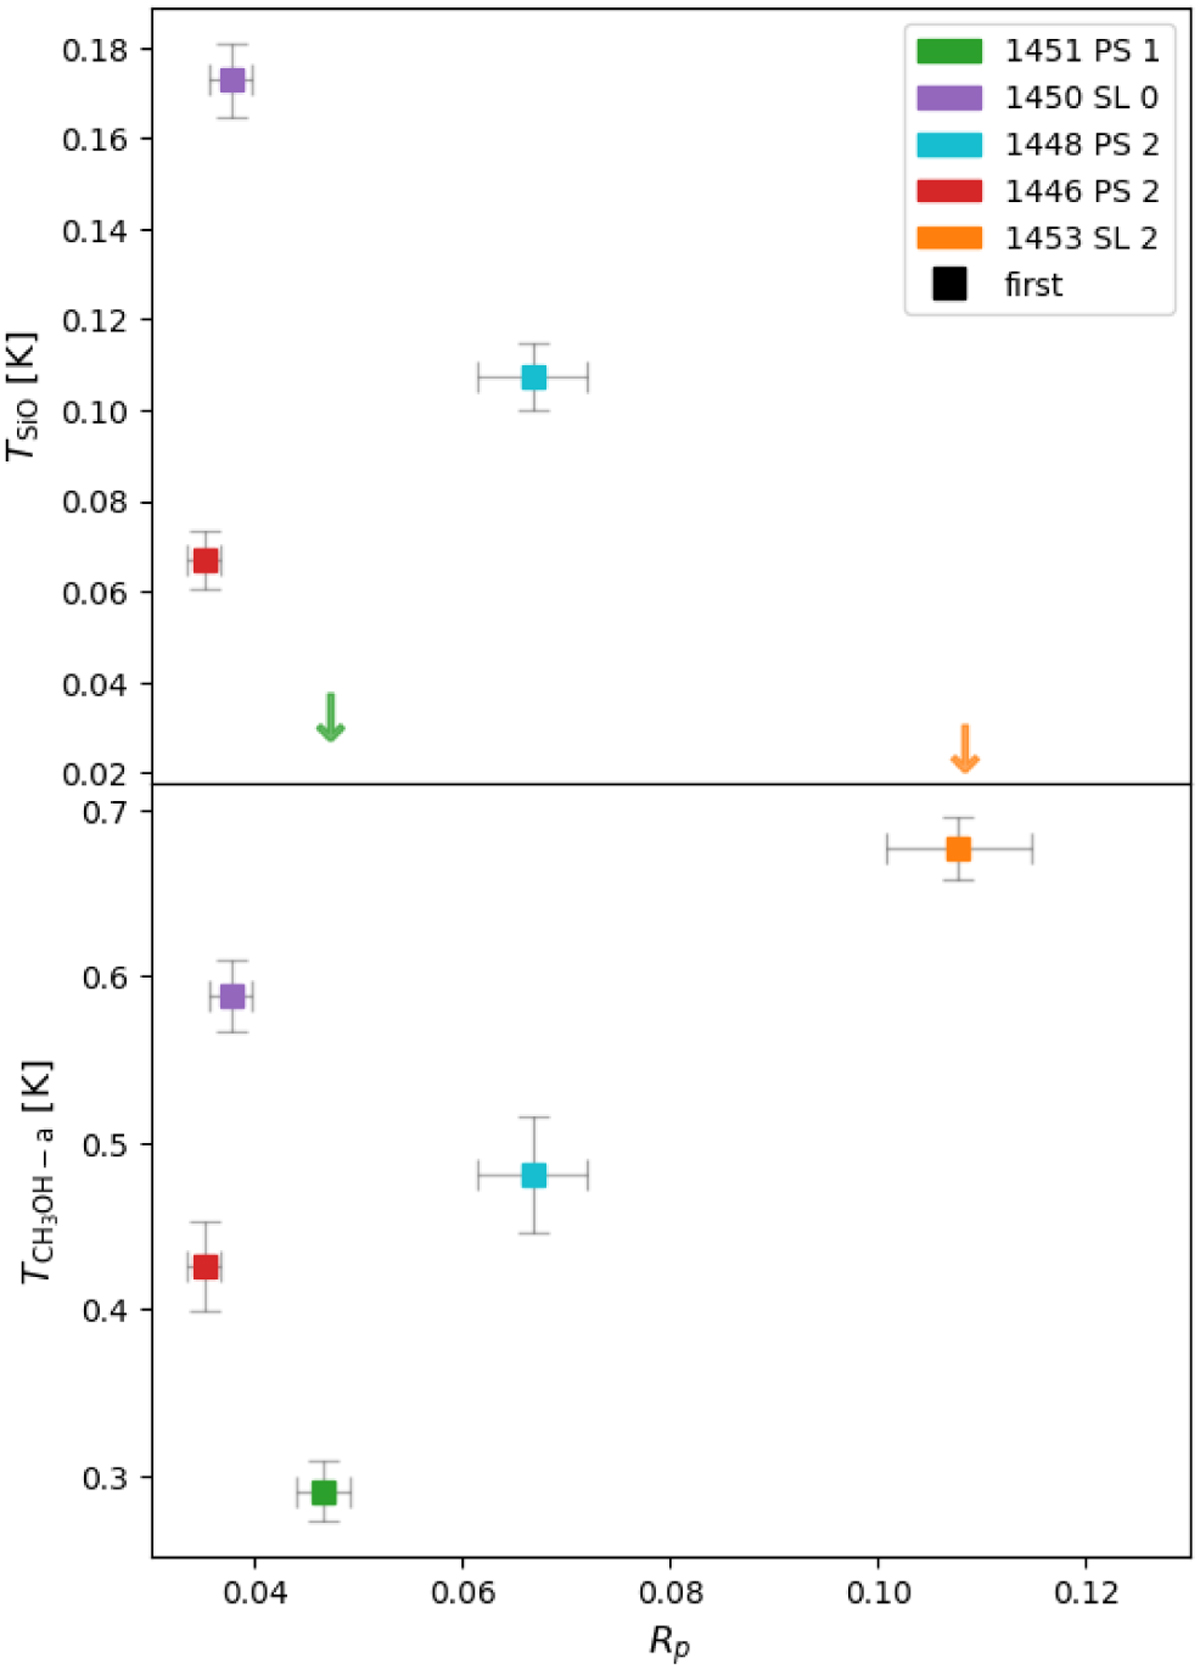
Fig. 10
Download original image
Relationship between shock tracer temperatures and gas pressure ratio. Top: SiO main-beam peak temperature as a function of gas pressure ratio calculated from NH3 line widths. The arrows mark the upper limits of SiO detection of the sources 1451 and 1453. Bottom: CH3OH peak temperature as a function of gas pressure ratio calculated from NH3 [line widths]. The columns of the legend are as in Fig. 5.
Current usage metrics show cumulative count of Article Views (full-text article views including HTML views, PDF and ePub downloads, according to the available data) and Abstracts Views on Vision4Press platform.
Data correspond to usage on the plateform after 2015. The current usage metrics is available 48-96 hours after online publication and is updated daily on week days.
Initial download of the metrics may take a while.