Fig. 1
Download original image
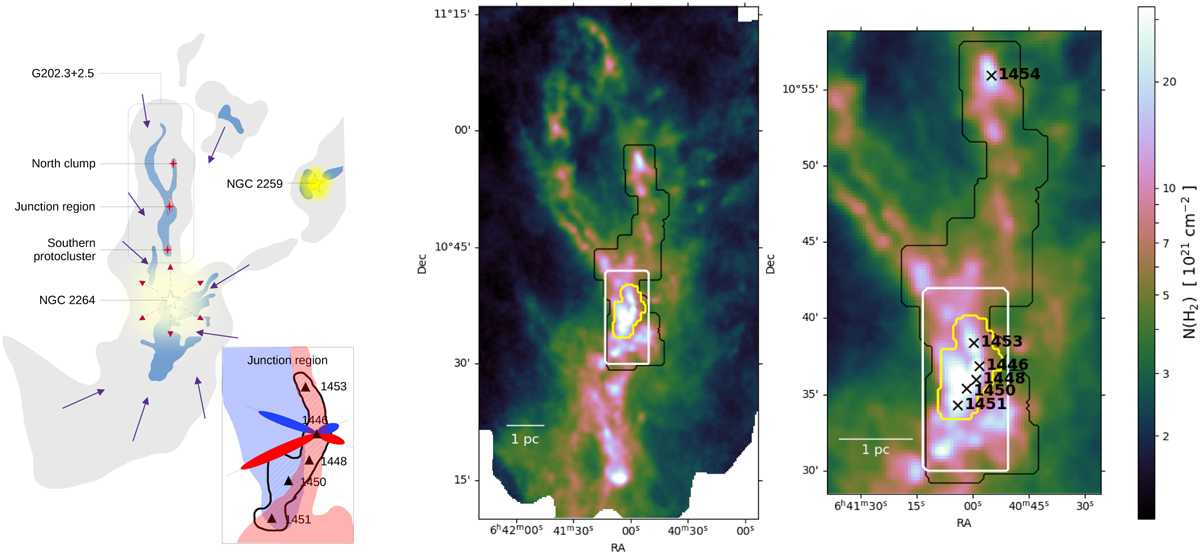
Overview of the morphology and the position of the G202.3+2.5 cloud. Left: schema of the G202.3+2.5 cloud within the context of Mon OB1 East, summarising the results from Paper II. The light gray and light blue areas show the low-density and intermediate-density molecular gas. The five-branch stars mark the positions of the two known open clusters, NGC 2264 and NGC 2259. The four-branch red stars mark the location of groups of protostars. The inward arrows represent the potential global collapse. The outward dashed arrows represent the radiative and mechanical influence exerted by the NGC 2264 open cluster on its surrounding. The insert shows a zoom-in view of the junction region, represented by the hatched area. The triangles mark the location of dense cores. The blue area shows the gas of the filament to the north-east of the junction region. The red area shows the gas of the filament the relates the southern protocluster to the north clump. The directions and red and blue lobes of the two outflows reported in Paper II are also shown. Middle: H2 column density map of the G202.3+2.5 cloud derived from the Herschel/SPIRE data (Montillaud et al. 2015). The lines show the areas of our first IRAM 30-m observations (thin black line; Paper I), of our new IRAM 30-m observations (thick white line), and of our Effelsberg 100-m observations (thick yellow line). Right: zoom-in view of the middle frame with the same colour scale. Black crosses mark the six sources of the GCC catalogue this paper is focussed on.
Current usage metrics show cumulative count of Article Views (full-text article views including HTML views, PDF and ePub downloads, according to the available data) and Abstracts Views on Vision4Press platform.
Data correspond to usage on the plateform after 2015. The current usage metrics is available 48-96 hours after online publication and is updated daily on week days.
Initial download of the metrics may take a while.