Fig. 8.
Download original image
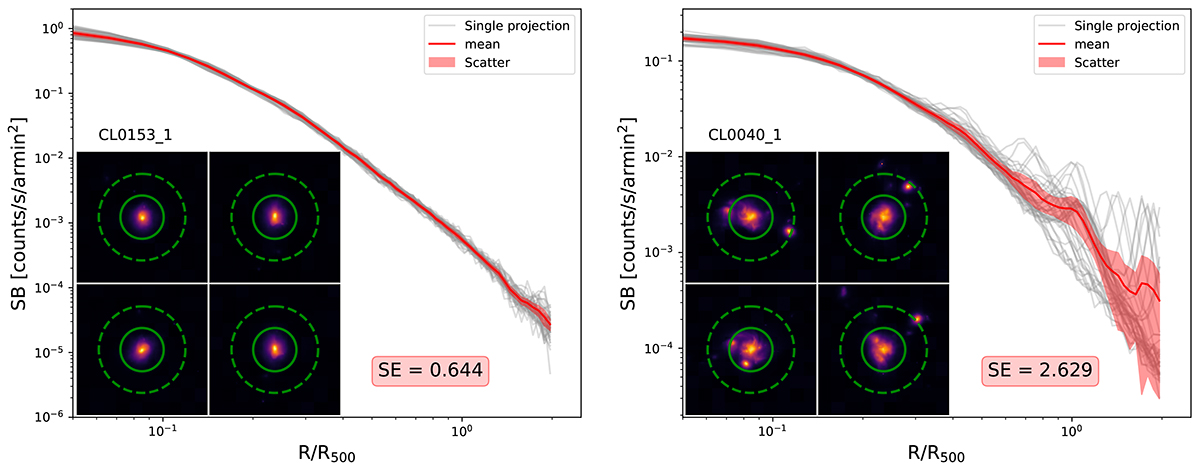
Comparison between each projected SB profile distribution of a regular (left panel) and irregular (right panel) cluster. The regular cluster maps appear very similar to each other despite the projection, so all the SB profiles that refer to different lines of sight present a similar behavior as well and thus show a narrow distribution. On the other hand, the irregular cluster appears very different depending on the considered projection, so its SB profile presents different shapes, making the profile distribution scatter considerable (depending on the radius).
Current usage metrics show cumulative count of Article Views (full-text article views including HTML views, PDF and ePub downloads, according to the available data) and Abstracts Views on Vision4Press platform.
Data correspond to usage on the plateform after 2015. The current usage metrics is available 48-96 hours after online publication and is updated daily on week days.
Initial download of the metrics may take a while.