Fig. 7.
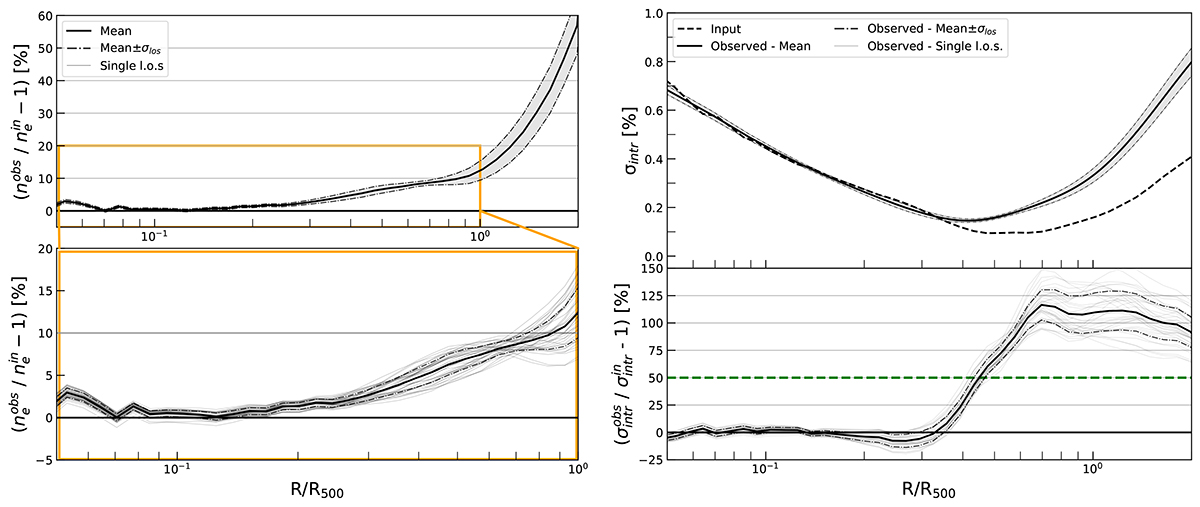
Download original image
Characterization of the bias introduced by the spherical assumption for the whole sample. Left figure: Bias in ICM density profile due to spherical assumption. In the bottom panel, we report the zoom of the innermost region. The gray lines refer to the global density profile for each sample realization (one for each line of sight), the solid black line refers to the mean over the sample realizations, and the dash-dotted lines refer to the 1σ value. Right figure: Scatter profile of the sample’s density profiles around the global density profile (upper panel) and the relative bias due to the spherical assumption (bottom panel). The lighter black lines refer to the scatter profile for each sample realization, the solid black line to the mean over the sample realizations, and the dash-dotted lines to the 1σ value. The black dashed line refers to the input profile, and the green dashed line refers to the 50% level.
Current usage metrics show cumulative count of Article Views (full-text article views including HTML views, PDF and ePub downloads, according to the available data) and Abstracts Views on Vision4Press platform.
Data correspond to usage on the plateform after 2015. The current usage metrics is available 48-96 hours after online publication and is updated daily on week days.
Initial download of the metrics may take a while.