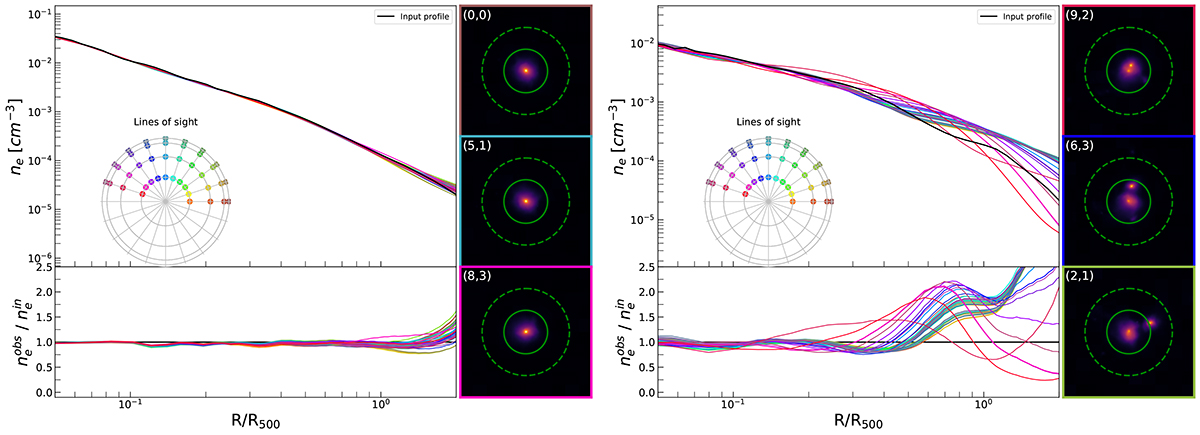
Fig. 6.
Download original image
Gas density profile along 40 lines of sight for two clusters chosen as examples. In the left figure, the regular cluster CL0129_1 is reported, while the right figure presents the irregular cluster CL0005_1. For both figures, the black line refers to the input gas density profile, and the colored lines refer to the observed profiles, extracted assuming spherical geometry for the gas spatial distribution. Each color refers to a specific line of sight, as reported on the polar plane. In the bottom panel of both figures, the observed-to-input ratio is reported for each line of sight. It is evident how the input profile is better reconstructed for the regular cluster. On the right of each figure, three cluster projections are reported (the color of the edges identifies the corresponding line of sight). The solid and the dashed circles refer respectively to R500 and 2R500. We note the smooth shape of CL0129_1, regardless of the projection, and the irregular shape of CL0005_1, where the substructure position changes with the projection.
Current usage metrics show cumulative count of Article Views (full-text article views including HTML views, PDF and ePub downloads, according to the available data) and Abstracts Views on Vision4Press platform.
Data correspond to usage on the plateform after 2015. The current usage metrics is available 48-96 hours after online publication and is updated daily on week days.
Initial download of the metrics may take a while.