Open Access
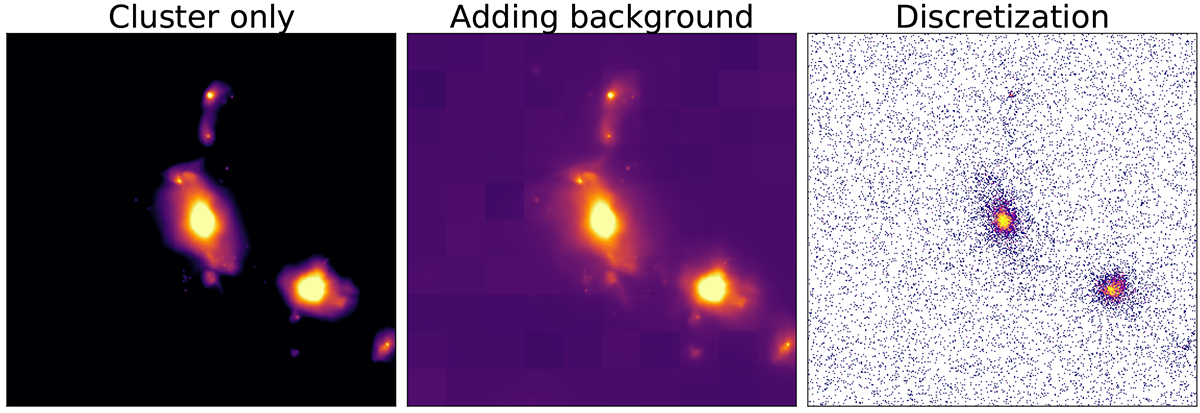
Fig. 4.
Download original image
Mock map generation process. Left panel: Map of the cluster emission. Central panel: Map of the cluster emission with the addition of the tiled background. Right panel: Map resulting from the discretization of the cluster+background map through a Poisson randomization. All maps are in units of counts.
Current usage metrics show cumulative count of Article Views (full-text article views including HTML views, PDF and ePub downloads, according to the available data) and Abstracts Views on Vision4Press platform.
Data correspond to usage on the plateform after 2015. The current usage metrics is available 48-96 hours after online publication and is updated daily on week days.
Initial download of the metrics may take a while.