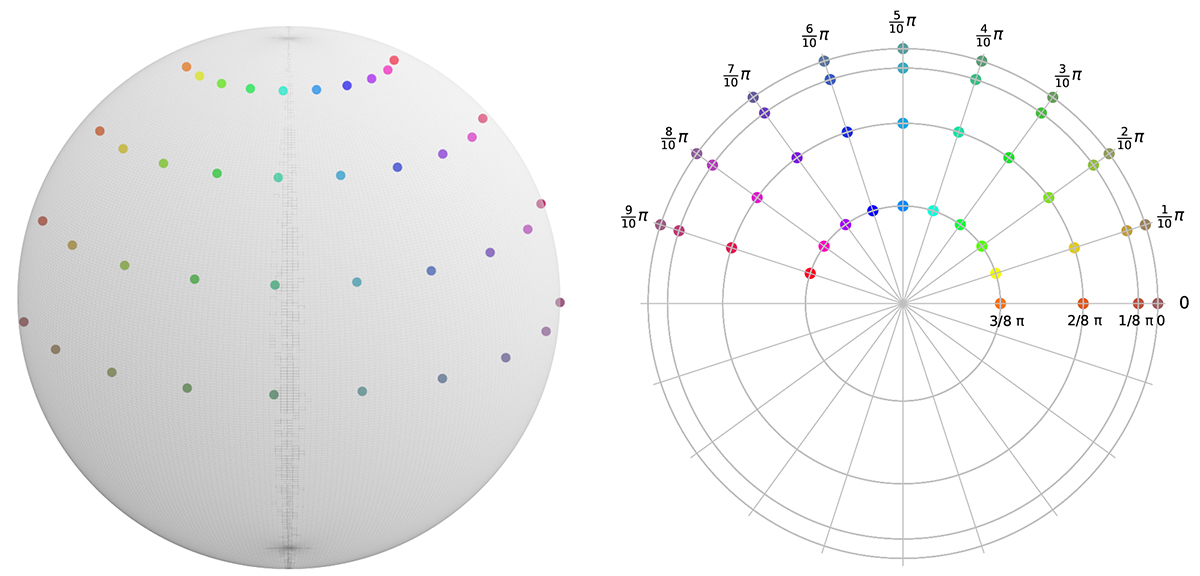
Fig. 3.
Download original image
Representation on a sphere (left) and on a polar plane (right) of the forty directions along which a three-dimensional simulated cluster is projected. The directions are distributed at intervals of Δθ = 1/10 π and Δϕ = 1/8 π, with θ ∈ [0, 9/10 π] and ϕ ∈ [0, 3/8 π], where ϕ = 0 identifies the equatorial plane. Every direction is identified as (t, p), where t ∈ [0, 9] and p ∈ [0, 3] represent θ and ϕ.
Current usage metrics show cumulative count of Article Views (full-text article views including HTML views, PDF and ePub downloads, according to the available data) and Abstracts Views on Vision4Press platform.
Data correspond to usage on the plateform after 2015. The current usage metrics is available 48-96 hours after online publication and is updated daily on week days.
Initial download of the metrics may take a while.