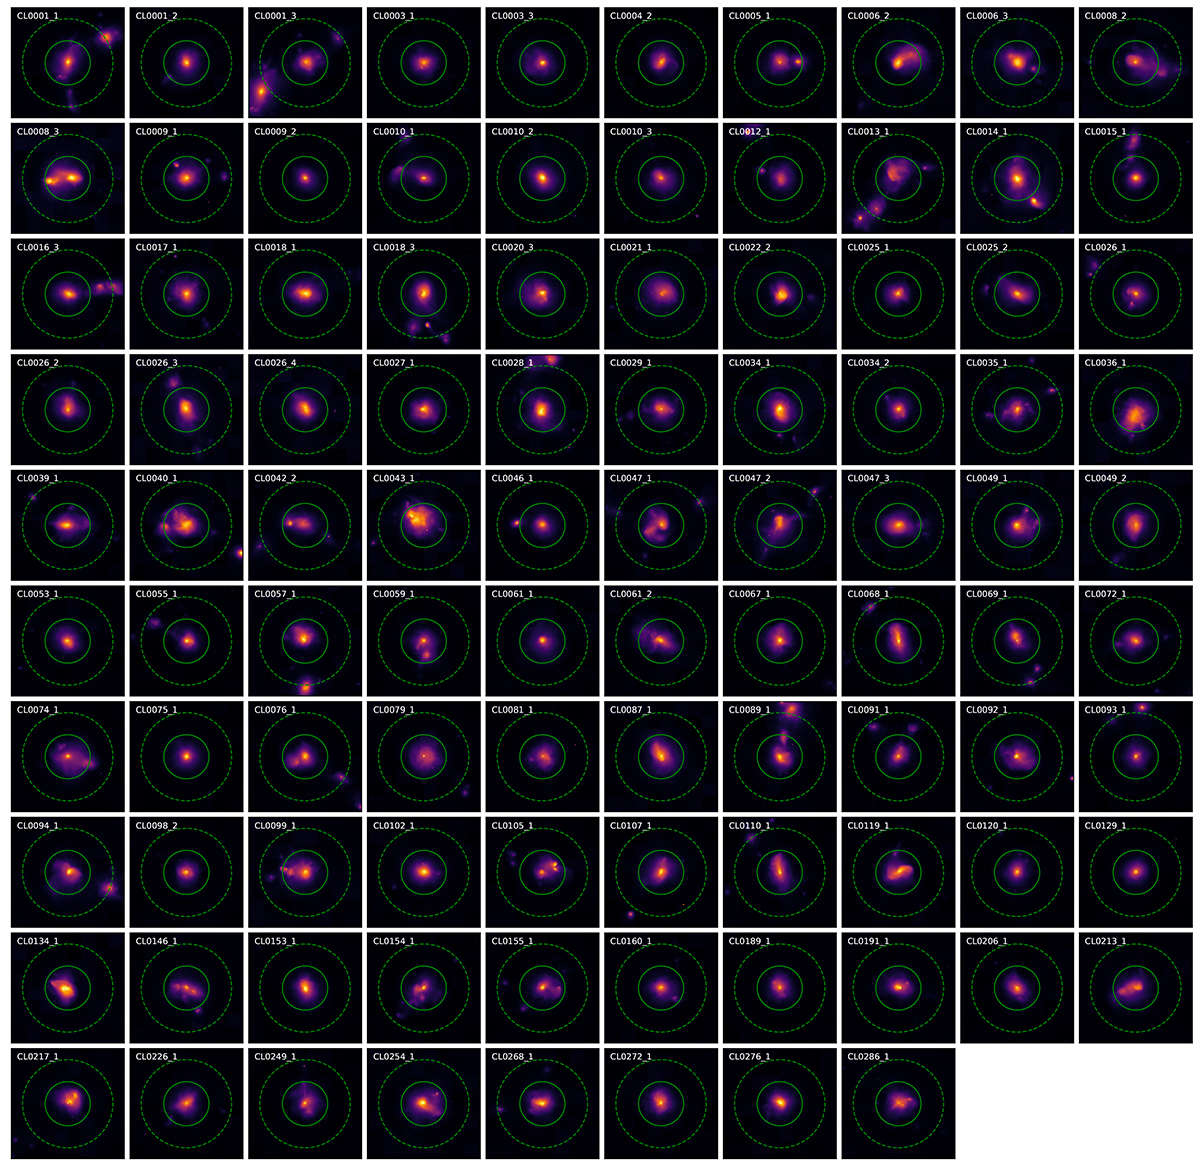
Fig. 2.
Download original image
Image gallery of the 98 galaxy clusters in the simulated sample. Each image covers an area of 5R500 × 5R500 and represents the spatial distribution of the ICM projected along one random direction in units of cm−6 Mpc. The solid circle indicates R500, while the dashed one indicates 2R500. In many clusters one or more substructures are present. The names of the simulated clusters are reported in each panel. The first number identifies the simulated region where the halo is extracted, and the second is the mass-rank index of the halo in that specific region. For example, CL0005_1 is the most massive cluster found in the fifth region.
Current usage metrics show cumulative count of Article Views (full-text article views including HTML views, PDF and ePub downloads, according to the available data) and Abstracts Views on Vision4Press platform.
Data correspond to usage on the plateform after 2015. The current usage metrics is available 48-96 hours after online publication and is updated daily on week days.
Initial download of the metrics may take a while.