Open Access
Fig. C.3.
Download original image
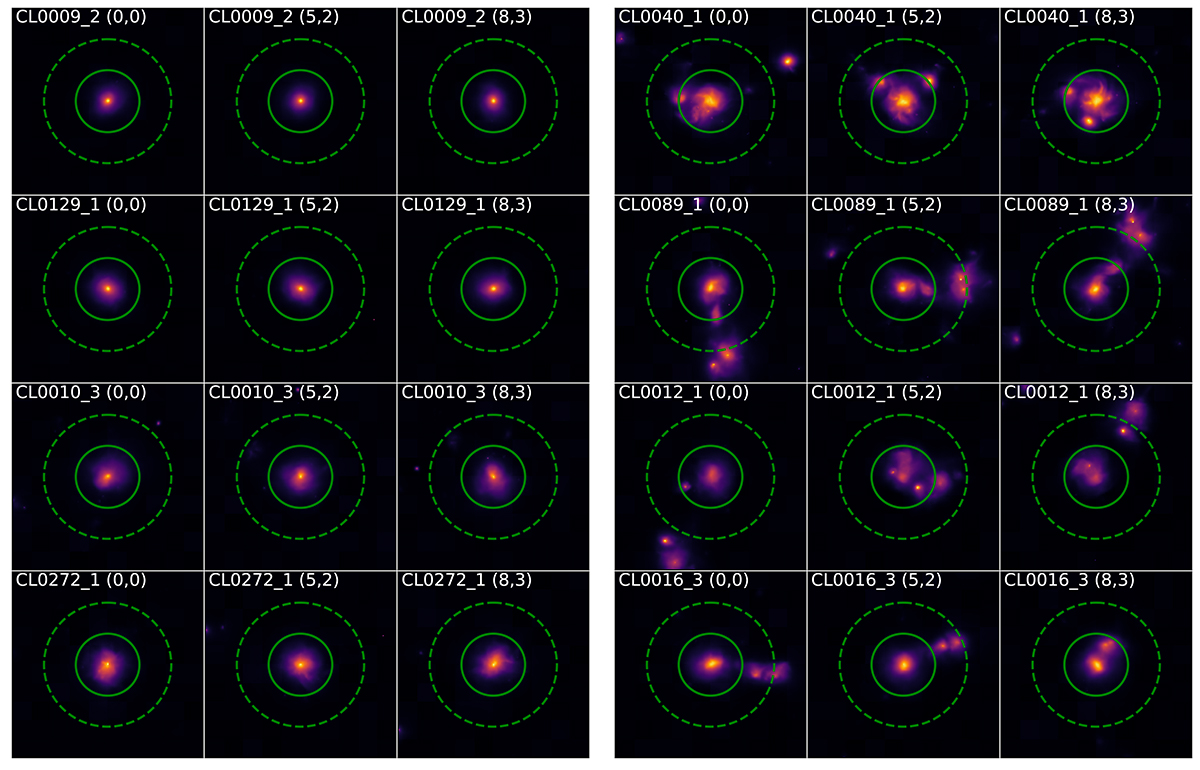
Example of clusters that compose the regular (left) and the irregular (right) sub-sample. For each clusters we report three different lines of sight (i.e. each column is a different sample realization). The solid and dashed circles represent respectively R500 and 2R500.
Current usage metrics show cumulative count of Article Views (full-text article views including HTML views, PDF and ePub downloads, according to the available data) and Abstracts Views on Vision4Press platform.
Data correspond to usage on the plateform after 2015. The current usage metrics is available 48-96 hours after online publication and is updated daily on week days.
Initial download of the metrics may take a while.