Open Access
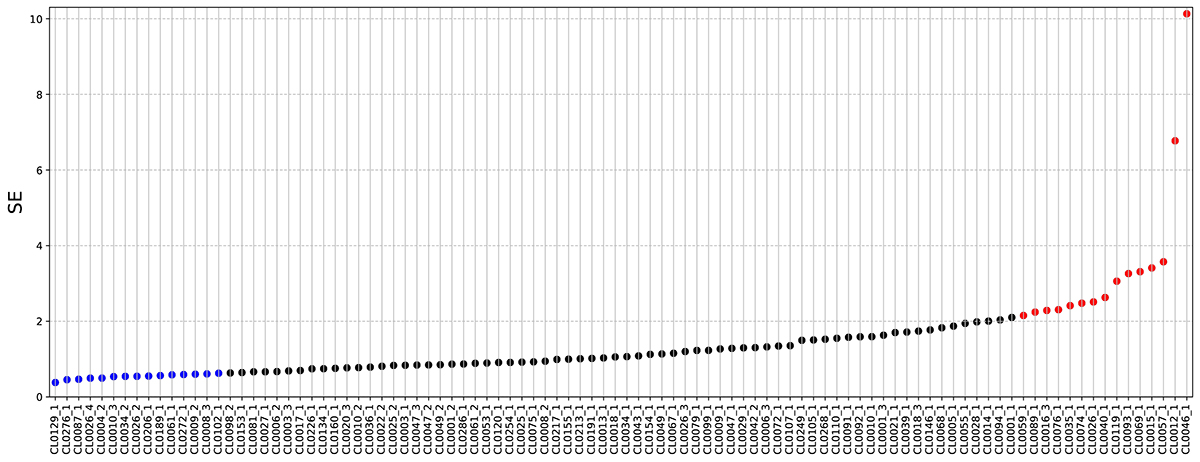
Fig. C.2.
Download original image
Shape estimator for each cluster in the sample, showed in ascending order, from the most regular to the most irregular. The blue clusters compose the regular sub-sample, the red clusters compose the irregular sub-sample.
Current usage metrics show cumulative count of Article Views (full-text article views including HTML views, PDF and ePub downloads, according to the available data) and Abstracts Views on Vision4Press platform.
Data correspond to usage on the plateform after 2015. The current usage metrics is available 48-96 hours after online publication and is updated daily on week days.
Initial download of the metrics may take a while.