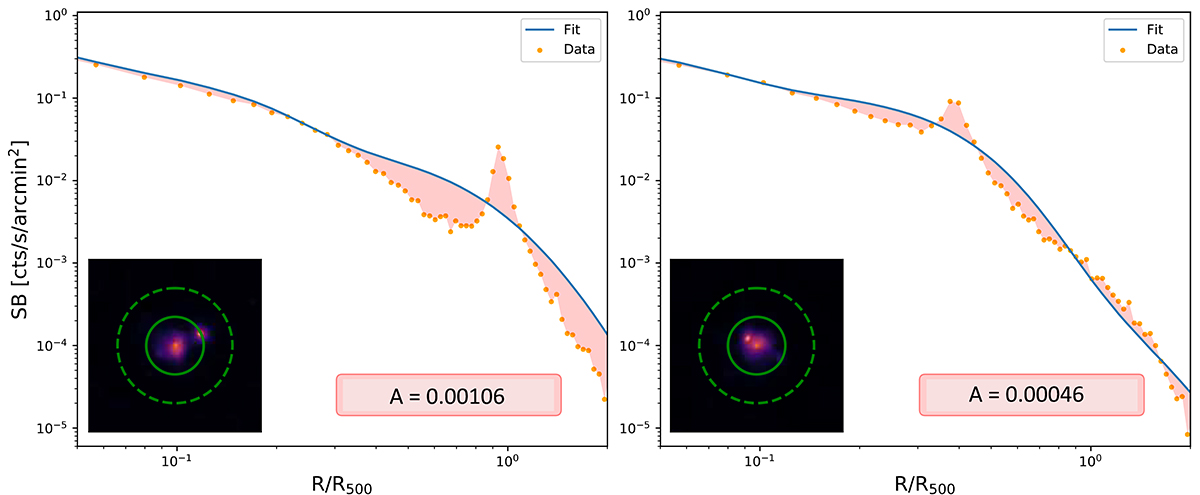
Fig. B.1.
Download original image
Surface brightness profile for cluster CL0005_1 seen from two different line of sight. The orange data point refers to the measured emission, the blue line refers to the fitted β-profiles combination model. The emission peaks correspond to the substructure emission: in the projection reported in the left figure the substructure appears in the outer regions of the cluster (R ∼ R500), while in the projection reported on the right the substructure appears near the central core. The difference between the fitted profile and the observed one can be quantified by the colored area that is larger when the substructure appears far from the central core, which means that if the substructure appear far from the central core the observed density profile results much more overestimated.
Current usage metrics show cumulative count of Article Views (full-text article views including HTML views, PDF and ePub downloads, according to the available data) and Abstracts Views on Vision4Press platform.
Data correspond to usage on the plateform after 2015. The current usage metrics is available 48-96 hours after online publication and is updated daily on week days.
Initial download of the metrics may take a while.