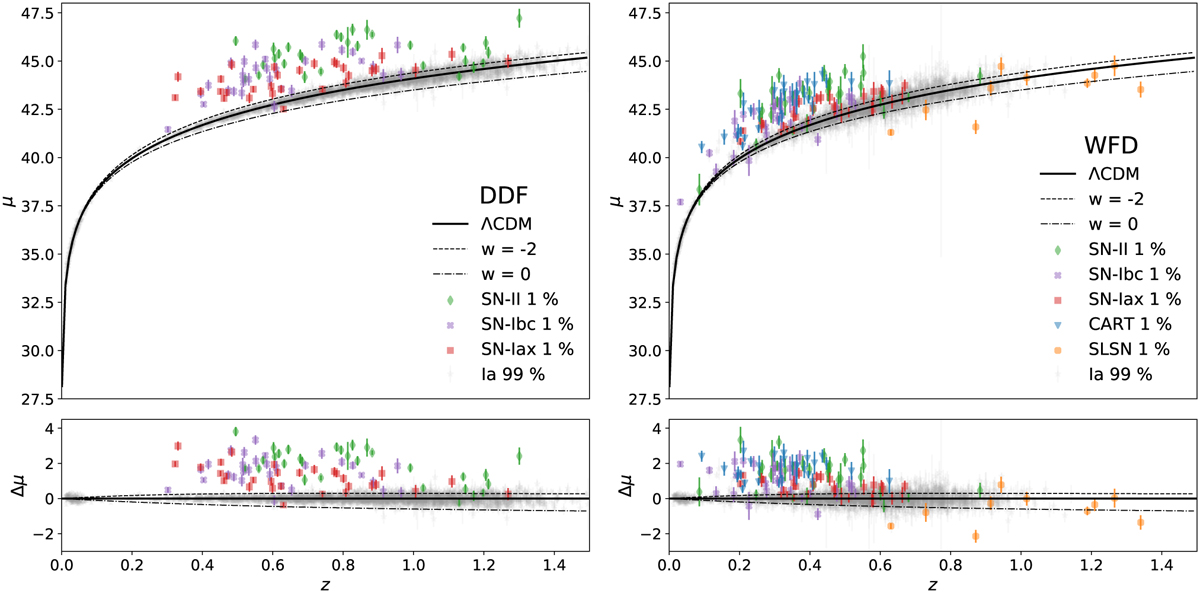
Fig. 6
Download original image
Hubble diagram (upper) and residuals (lower) showing the ΛCDM model (solid black line) and two others depicting extreme dark energy behaviors (w = −2 - dashed, and w = 0 − dot-dashed). The gray points correspond to 2970 randomly selected SNe Ia from the available sample plus the low-z anchor SNe Ia, and the contaminants are shown at 1% contamination (class-specific shapes and colors) in DDF (left) and WFD (right). While some individual contaminant light curves have SALT2mu fit parameters far from those of the true SNe Ia, there is nontrivial overlap that would preclude simply classifying by eye to remove them from a sample entirely as expected given the selection criterion of a convergent SALT2mu fit); in the DDF, this effect is noticeable among the SN-Iax contaminants as well as SN-Ibc and SN-II at z > 0.8, whereas in the WFD, the problem is more severe, affecting all contaminants except CART and at redshifts as low as z > 0.2.
Current usage metrics show cumulative count of Article Views (full-text article views including HTML views, PDF and ePub downloads, according to the available data) and Abstracts Views on Vision4Press platform.
Data correspond to usage on the plateform after 2015. The current usage metrics is available 48-96 hours after online publication and is updated daily on week days.
Initial download of the metrics may take a while.