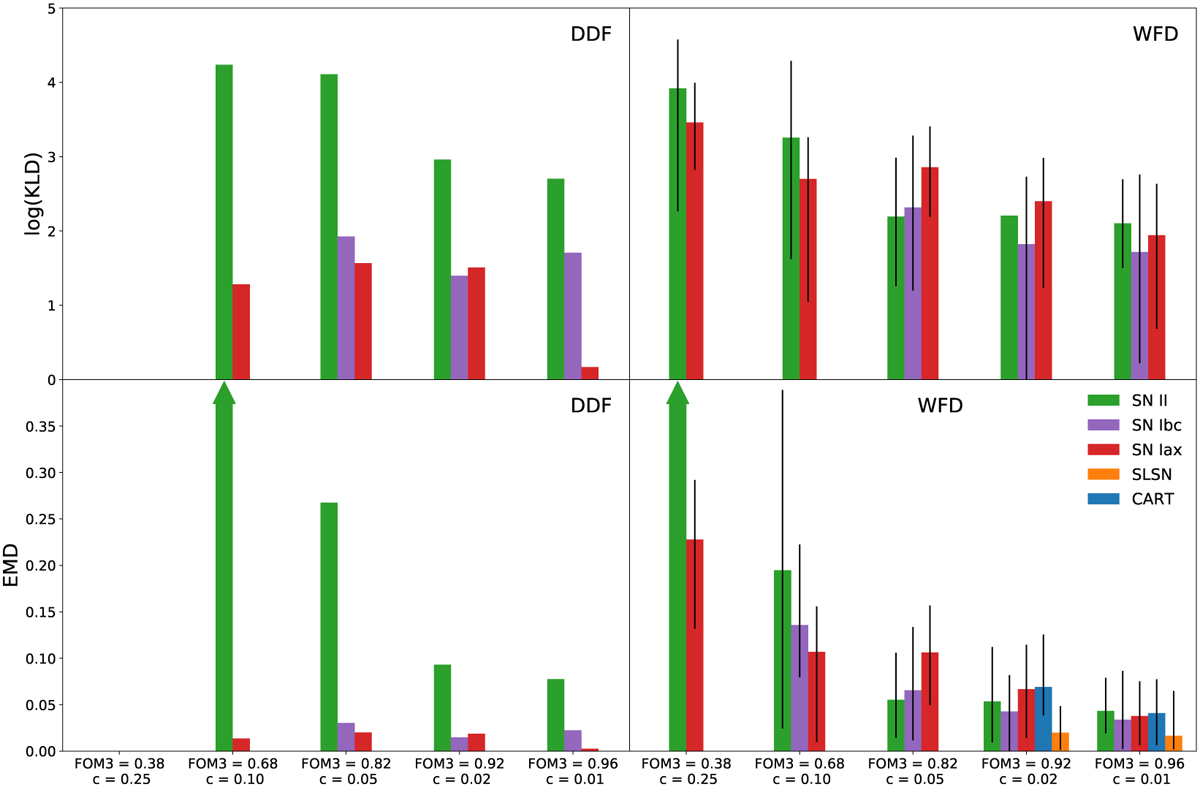
Fig. 5
Download original image
The log-KLD and EMD of posterior samples of w at different values of the FOM3 classification metric for each contaminating class (color) and observing strategy (panel). The vertical lines within the WFD panels indicate the minimum and maximum values among ten different realizations. Despite the considerable variability between realizations, the cosmology metrics do exhibit consistent sensitivity to the impact of different classes of contaminant at a given contamination level. Examples of this effect manifest as stratification among the classes at a given FOM3 value.
Current usage metrics show cumulative count of Article Views (full-text article views including HTML views, PDF and ePub downloads, according to the available data) and Abstracts Views on Vision4Press platform.
Data correspond to usage on the plateform after 2015. The current usage metrics is available 48-96 hours after online publication and is updated daily on week days.
Initial download of the metrics may take a while.