Fig. 4
Download original image
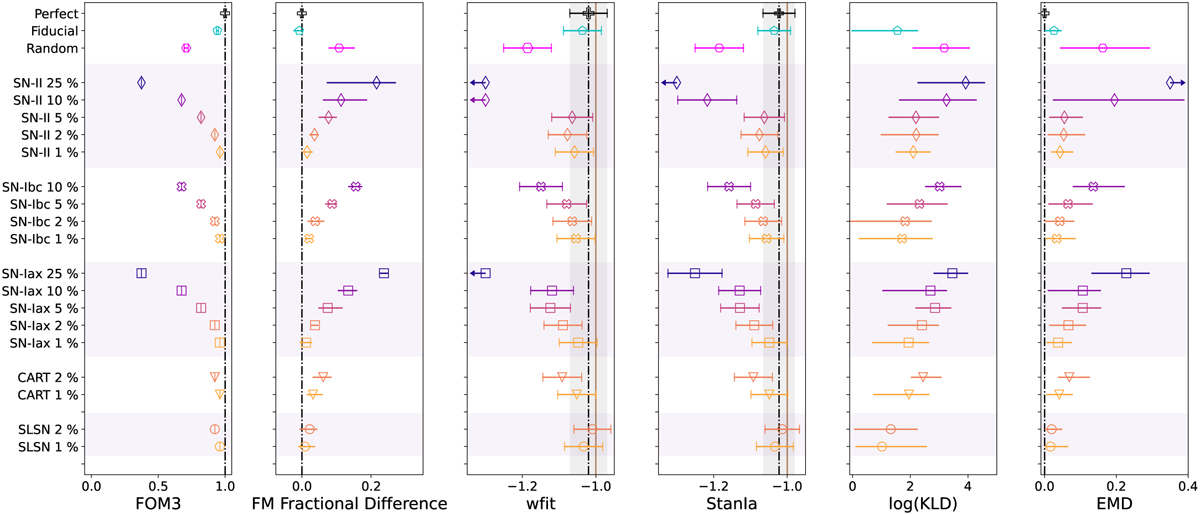
Equivalent of Figure 3 for the WFD based on ten realisations of each sample. The plotted uncertainties in the constraints on w (central two panels) correspond to the largest ![]() out of the ten trials. Similarly, the plotted uncertainties on the posterior PDFs on w (rightmost two panels) and the Fisher Matrix fractional difference (second panel from left) indicate the maximum and minimum metric values out of the ten trials.
out of the ten trials. Similarly, the plotted uncertainties on the posterior PDFs on w (rightmost two panels) and the Fisher Matrix fractional difference (second panel from left) indicate the maximum and minimum metric values out of the ten trials.
Current usage metrics show cumulative count of Article Views (full-text article views including HTML views, PDF and ePub downloads, according to the available data) and Abstracts Views on Vision4Press platform.
Data correspond to usage on the plateform after 2015. The current usage metrics is available 48-96 hours after online publication and is updated daily on week days.
Initial download of the metrics may take a while.