Fig. 3
Download original image
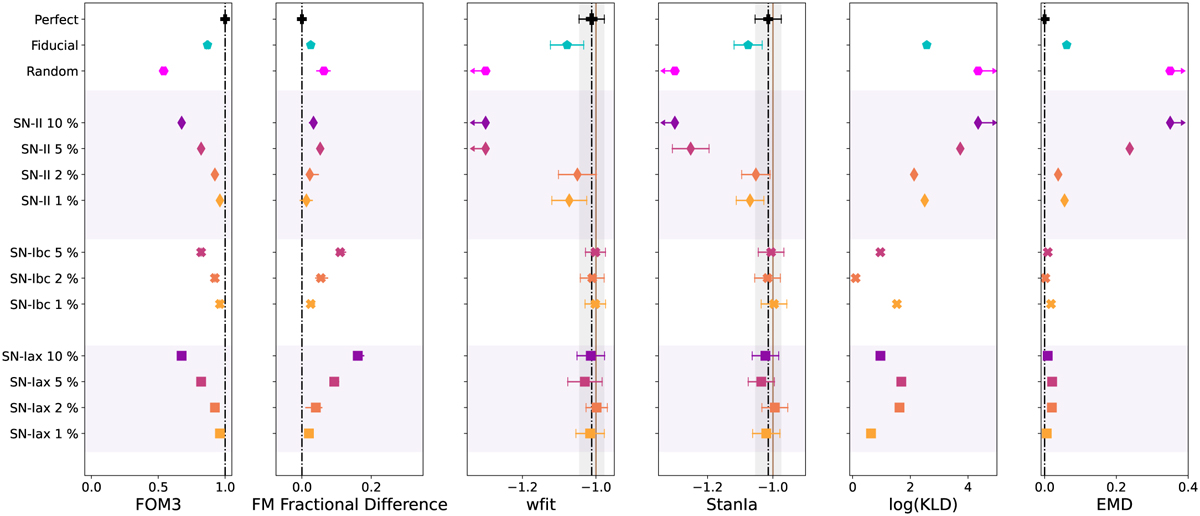
Metrics summary for the DDF, with metric values on the x-axes and light curve samples on the y-axis, grouped by contaminant (shape and light purple backgrounds) and ranked by contamination fraction (color) aside from the ‘perfect’, ‘fiducial’, and ‘random’ light curve samples defined in Section 2.2, using the same colors for the named mock samples as in Figure 2. Reference values (vertical lines; dash-dotted black for the pure sample with 1-σ error regions in gray and solid brown for the truth) are provided where appropriate. The constraints on w (central two panels) include both the mean, ![]() , and standard deviation,
, and standard deviation, ![]() .
.
Current usage metrics show cumulative count of Article Views (full-text article views including HTML views, PDF and ePub downloads, according to the available data) and Abstracts Views on Vision4Press platform.
Data correspond to usage on the plateform after 2015. The current usage metrics is available 48-96 hours after online publication and is updated daily on week days.
Initial download of the metrics may take a while.