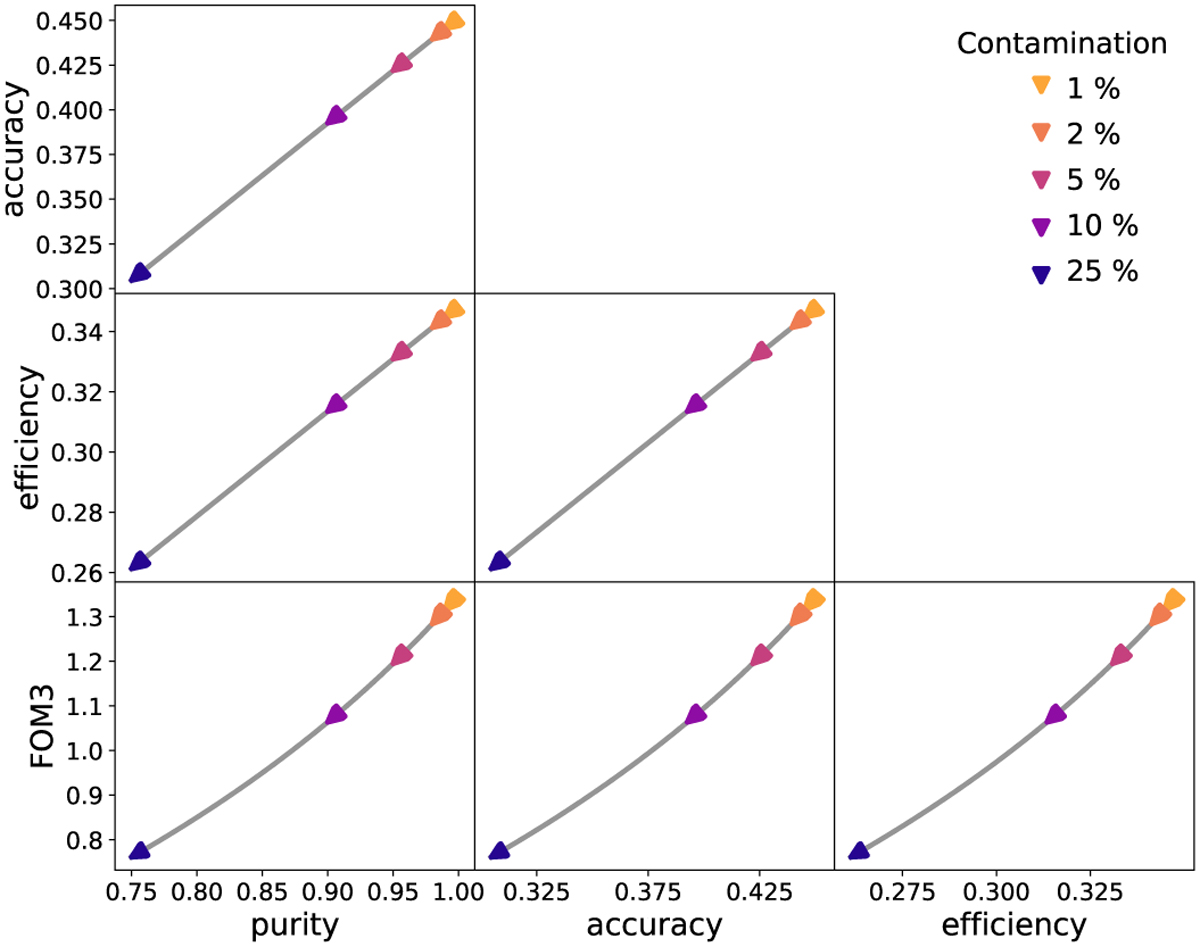
Fig. 1
Download original image
Traditional deterministic metrics as a function of each other for increasing values (arrows) of the contamination parameter (c = 0.01, 0.02, 0.05, 0.10, 0.25), indicated in light orange, dark orange, pink, violet, and navy, respectively. Though these metrics are functions of the same four variables (see Equations (1), (2), (3), and (4)) and should thus be expected to have consistent relationships at all values of c, the detailed shapes depend on the values of the true and false positive and negative rates; this demonstrative plot thus reflects the proportions of SNe Ia and non-SNe Ia under the DDF observing strategy from Table 1 and our cosmological sample size of 𝒩 = 3000 (see Section 2.2.2). As anticipated, these metrics are degenerate with one another and are insensitive to the contaminating class makeup, only probing the contamination rate.
Current usage metrics show cumulative count of Article Views (full-text article views including HTML views, PDF and ePub downloads, according to the available data) and Abstracts Views on Vision4Press platform.
Data correspond to usage on the plateform after 2015. The current usage metrics is available 48-96 hours after online publication and is updated daily on week days.
Initial download of the metrics may take a while.