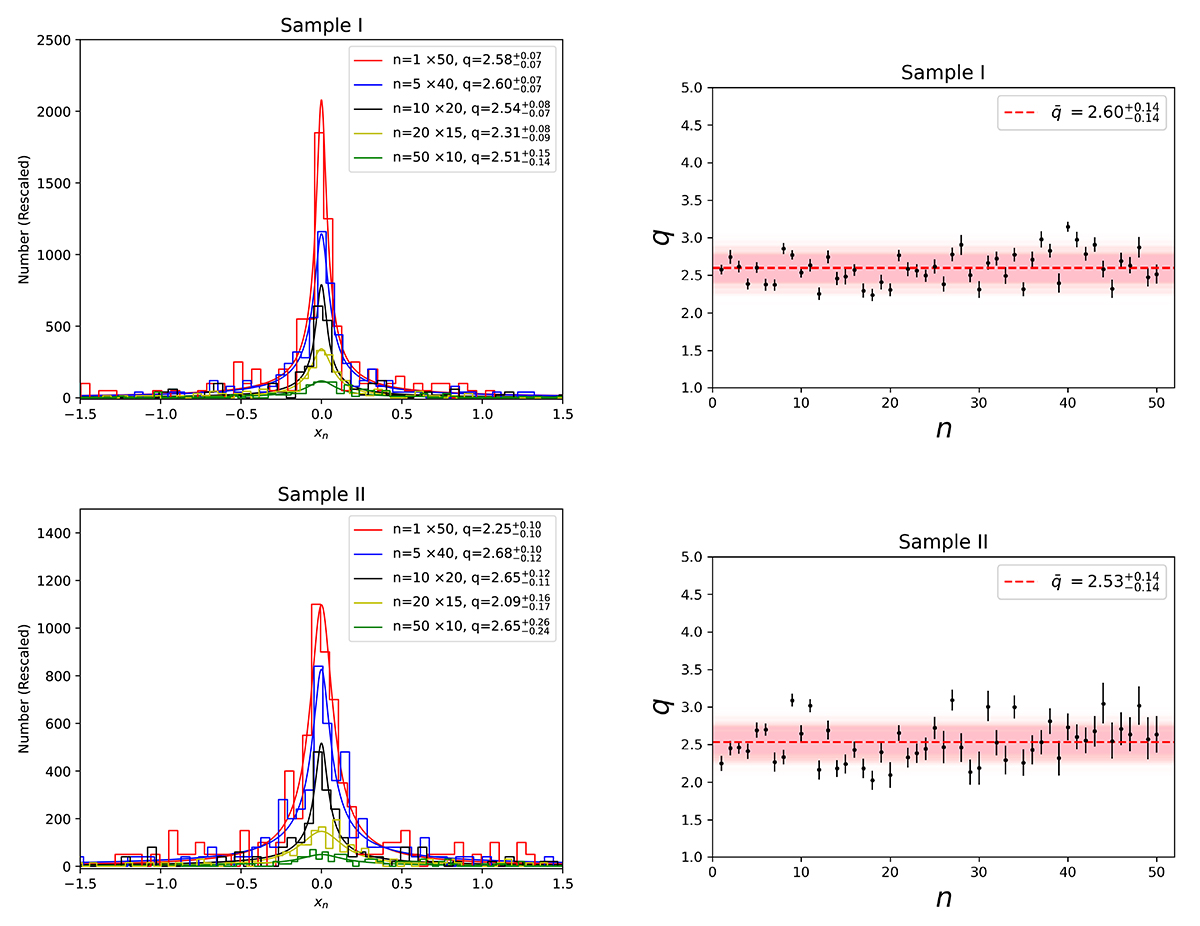
Fig. 2.
Download original image
Data (xn) distributions and fitting results about q-Gauss. The left panel shows several examples of xn distributions for different values of n and corresponding fitting curves (which have been rescaled to distinguish each sample). The right panel shows the evolution between the best-fitting results of q (with 1-σ error) and n of PDFs.
Current usage metrics show cumulative count of Article Views (full-text article views including HTML views, PDF and ePub downloads, according to the available data) and Abstracts Views on Vision4Press platform.
Data correspond to usage on the plateform after 2015. The current usage metrics is available 48-96 hours after online publication and is updated daily on week days.
Initial download of the metrics may take a while.