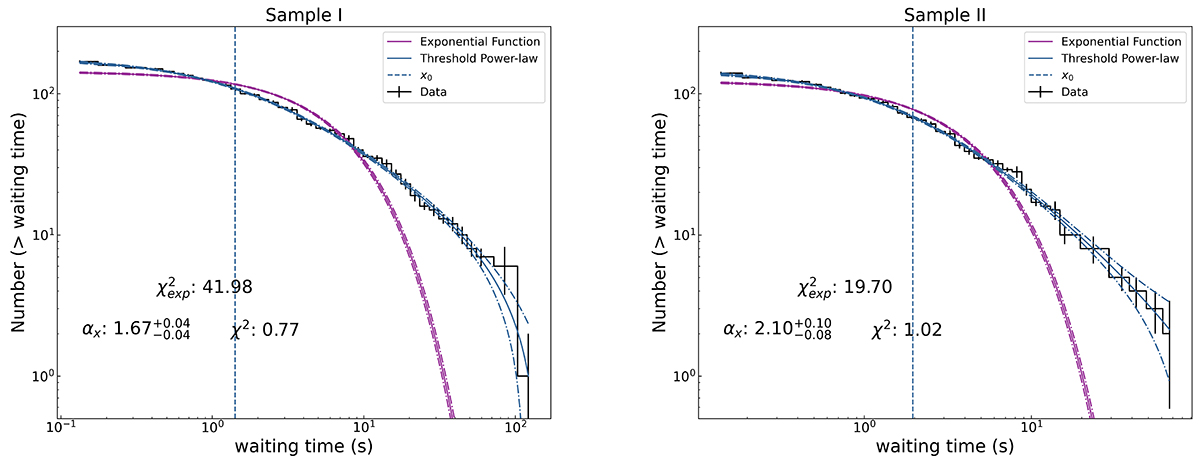
Fig. 1.
Download original image
Waiting time distributions and fitting results. The two panels depict the cumulative distributions of waiting time for Sample I and Sample II, which have been fit with an exponential (Eq. (1)) and a threshold power law (Eq. (3)). The solid lines represent the best-fitting results for each function, while the regions between the two dash-dotted lines indicate the 95% confidence level for each. Additionally, the dashed lines correspond to the thresholded values, x0, for the threshold power law.
Current usage metrics show cumulative count of Article Views (full-text article views including HTML views, PDF and ePub downloads, according to the available data) and Abstracts Views on Vision4Press platform.
Data correspond to usage on the plateform after 2015. The current usage metrics is available 48-96 hours after online publication and is updated daily on week days.
Initial download of the metrics may take a while.